


Jan 18, 2018
An icing analysis of the Maple Leafs
Travis Yost takes a closer look at icing data to measure how well Toronto’s lineup applies or deals with pressure.
By Travis Yost

Hockey, like most sports, is a game about pressure. The teams that regularly apply pressure can force opponents into mistakes. The teams that deal poorly with pressure usually end up in the draft lottery.
There are a few ways to measure the ability to apply or deal with pressure. One way we have looked at this in the past deals with multi-shot shifts. That analysis, though at the team level, looked at how frequently teams were able to enter and sustain pressure in the offensive zone. Not surprisingly, the teams that were more successful at holding the offensive zone were also generally more successful on the goal-scoring front.
Another way to look at this is through icing data. The NHL play-by-play records icing events, but few sites have this data available for public consumption. I find that interesting because icing events are regular and can lead to painful shifts, with tired units trying to stave off goal-scoring threats. I also find it interesting because forcing or being forced into an icing isn’t random. More talented skaters tend to force more icing events, and less talented skaters tend to be victimized by their own icing of the puck.
Remember Christian Fischer’s goal against Toronto from a few weeks ago? If you watch the NHL.com highlight video, you see a pretty boilerplate marker – offensive zone draw win, puck cycled back to the top, and a player scoring off of a rebound opportunity seconds later.
What you don’t see, though, is what preceded this goal. The shift actually started 5-on-5. Toronto iced the puck, and was forced to leave the same five-man unit on the ice. Toronto lost the ensuing draw and Dominic Moore immediately took a hooking penalty. And since Toronto isn’t exactly flush with elite penalty killers, it meant Ron Hainsey had to play more than two minutes on consecutive shifts. It’s the little things that add up.
Toronto is a particularly interesting case study for an icing analysis. Offensively, they are fantastic – a quick-skating unit that can forecheck like hell when they are on their game. Defensively, they are a mess. Head coach Mike Babcock doesn’t really seem to have one pairing that he genuinely trusts in all game states, and the team at aggregate has already given up 133 goals (20th in the NHL).
That made me curious about how Toronto skaters measured up in an icing analysis. Which players more frequently drove opponents into tough consecutive shifts? Which players were the ones regularly bottled up in the defensive zone?
The below scatter plot shows just that. Anyone to the right of the diagonal dotted line is a player who has a higher Icing%, or alternatively, a player who generates more icings than takes them. Anyone to the left of the line is a player who sees his line ice the puck more than the opposition.
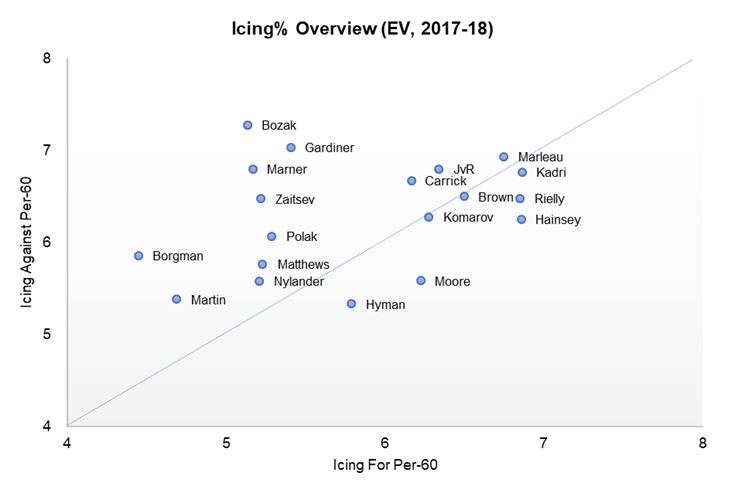
There are a couple of notable items here. First, the best regular payers by Icing% are forward Zach Hyman and defenceman Ron Hainsey (Moore also grades well here, but keep in mind he has played on a limited basis). Hyman is particularly interesting because he has earned a reputation as a ferocious forechecker and the type of player who can force opposing skaters into uncomfortable situations.
On Hainsey: I have a theory that one five-man unit in Toronto is exceptional at applying pressure. If you focus on the horizontal axis only, you’ll note that the aforementioned Hainsey, Patrick Marleau, Nazem Kadri, Leo Komarov, and Morgan Rielly all grade out comfortably above the team average. This five-man unit plays together quite regularly – Marleau, Kadri and Komarov have spent about 300 minutes together, and Hainsey-Rielly more than 600 minutes together. It’s something to keep an eye out for when this group is on the ice in the future for sure.
There are two sides to the story in Toronto though. No player has a worse Icing% than centre Tyler Bozak, though four other players (Andreas Borgman, Nikita Zaitsev, Mitch Marner, and Jake Gardiner) are all below 45 per cent. None of these guys, save maybe Zaitsev, are known for their defensive prowess. And this is where they are being victimized – their icing against rates are substantially higher than team average.
For Zaitsev, this isn’t the company you want to keep. He’s certainly not paid because of his offensive skills, and if he and his linemates have trouble exiting the zone with frequency, you start to wonder about how much value he’s providing in certain areas of the ice.
One concluding note: Toronto’s Icing% at aggregate is around 48 per cent. This makes some sense, as they are a shot-neutral team (50 per cent) that is leading more than trailing in games. But it also highlights a possible underlying issue with their declining shot rates. A clean transition game is what drives shots, scoring chances, and goal scoring. Right now, I’m not sure Toronto has that figured out.