
Dec 27, 2016
Are the Wild and Blue Jackets contenders or pretenders?
Minnesota and Columbus have been obliterating the competition so far this season. Travis Yost dives into the numbers to see which team has a better shot at sustaining that success in the new year.
By Travis Yost

Every season a couple of National Hockey League teams emerge as unexpected world-beaters, racking up win after win en route to a surprise playoff berth.
When teams suddenly emerge, the usual question they face is an obvious one: Is the success real, and is it sustainable? The NHL – perhaps more so than any other North American sports league – lends itself to teams running hot and cold regardless of how well (or how poorly) they’re playing. Talent tends to win out in the end, but it does make team-level analysis quite tricky when you are trying to separate pretenders from contenders.
One of the most prominent signals on either end of the spectrum is when a team sees a large divide between territorial dominance (be it by shots, scoring chances or expected goals) and shooting/save percentages. Your true playoff-calibre teams and eventual Stanley Cup winners tend to dominate the volume of chances over the duration of the regular season to sustain their winning ways. Pretenders, on the other hand, tend to ride the percentages – be it a white-hot shooting lineup or incredible goaltending. These teams are the ones that usually get themselves into trouble, and watch performance degrade as the season progresses.
The question about contender and pretender status is particularly interesting this year in light of the rise of the Columbus Blue Jackets in the East and the Minnesota Wild in the West, two teams that are obliterating the competition through the Christmas break. Columbus currently sits atop the NHL with 23 wins and a ridiculous +45 goal differential, which is also tops. Minnesota is fifth in the NHL with 21 wins and a +36 goal differential, second only to Columbus.
As you might have guessed by the lofty goal differentials, these two teams are dominating the percentages. Their PDO — the sum of a team’s shooting and save percentage — also sits at the top of the league.
PDO through Christmas
| RK | Team | EVSH% | EVSV% | PDO |
|---|---|---|---|---|
| 1 | Minnesota | 9.1 | 94.5 | 1036 |
| 2 | Columbus | 8.9 | 94.3 | 1032 |
| 3 | Chicago | 7.8 | 94.7 | 1025 |
| 4 | Montreal | 8.4 | 94.0 | 1024 |
| 5 | Washington | 7.9 | 94.2 | 1021 |
| 6 | NY Rangers | 9.7 | 92.2 | 1019 |
| 7 | NY Islanders | 8.9 | 92.2 | 1011 |
| 8 | Pittsburgh | 8.0 | 92.5 | 1004 |
| 9 | Detroit | 7.9 | 92.5 | 1004 |
| 10 | Toronto | 8.1 | 92.2 | 1003 |
| League Average | 7.5 | 92.5 | 1000 |
You can see the league averages below the top-10 table, but the story for both teams is clear: they are multiple standard deviations above league average on both the shooting and save percentage front and it’s been a substantial drivers for their success.
But, remember: PDO historically regresses pretty sharply to 1000. The very, very few teams who have been able to sustain PDO above 1000 have generally done it by having all-world goaltenders like Carey Price or Henrik Lundqvist, and even then you’re talking about a hair above 1000 – not nearly the incredible numbers you are seeing from Columbus and Minnesota.
The reason why this is important? I think it’s fair to argue that our best forecast for Columbus and Minnesota’s PDO for the next 50 or so games is, well, 1000. To that end, it’s important to know if either or both of these teams can sustain their winning through territorial dominance.
So, which of these teams would we be comfortable betting on this season to continue piling up the wins and making a push for a division title? Here are the trending shot numbers for both Columbus and Minnesota. There’s an interesting divide here:
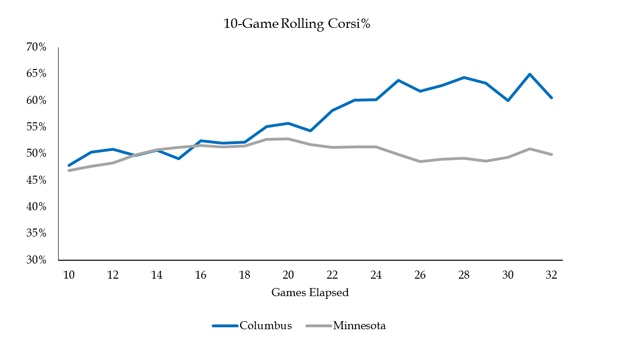
I’ve been a big critic of the Blue Jackets organization over the past five or so years. Suffice to say, that criticism is evaporating into thin air in the 2016-17 season. Columbus might be getting the majority of the bounces heading their way, but it’s hard to argue that they don’t deserve it – they are obliterating their competition on a nightly basis and playing the vast majority of time in the offensive third.
Pair their 5-on-5 dominance with maybe the best power-play unit in the league, and it’s hard to figure how the Blue Jackets get derailed this year. That’s the beauty of out-shooting teams 60-40 on a nightly basis. When you are go through that inevitable stretch where you can’t buy a bounce at either end of the ice, volume can smooth over a lot of the pain, turning regulation losses into overtime losses and overtime games into wins. This is a team that looks like a very real, very scary machine in the Eastern Conference, and yes, it seems to have come out of the blue.
Minnesota is a different story. Their scoring chance numbers are a bit better than their Corsi numbers, but either way the Wild look like a potential regression candidate as the season progresses. Their 5-on-5 numbers are, at best, average. And while they have an exceptional penalty kill, their power play has been punchless. The Wild are different from the Blue Jackets in the sense that they seem to be heavily reliant on the rate at which shots find the net (especially in their defensive zone) as opposed to the frequency with which they are generating or deterring shots against.
Three points here that you can find solace in if you’re a Wild fan. One, Bruce Boudreau is an exceptional coach and his teams have done nothing but win since he came into the league. As a new coach, I think it’s fair to say that he probably needs more than 30 games to have a truly well-oiled machine, and as such, expecting some improvement in his system isn’t unrealistic. Two, the Western Conference stinks this season. In years past, the Wild had to be truly great to make the playoffs. This year, they likely only have to be good to not only earn a berth, but own home ice in the first round. And three, their 5-on-5 numbers aren’t bad – they just aren’t indicative of what we are accustomed to from Stanley Cup-calibre teams.
Lastly: if you think my point about Corsi% (or ScoringChance%, for that matter) versus PDO isn’t important, please consider the resume of prior Stanley Cup winners. Just about all of them dominated at 5-on-5. PDO? It looks, well, random.
Corsi% vs. PDO (Cup Winners)
| Year | Team | Corsi% | Rank | PDO | Rank |
|---|---|---|---|---|---|
| 2007-08 | Det | 58.7 | 1 | 1001 | 16 |
| 2008-09 | Pit | 48.1 | 19 | 1022 | 3 |
| 2009-10 | Chi | 56.5 | 1 | 989 | 26 |
| 2010-11 | Bos | 50.7 | 14 | 1024 | 1 |
| 2011-12 | LA | 54.8 | 2 | 990 | 28 |
| 2012-13 | Chi | 54.1 | 4 | 1019 | 3 |
| 2013-14 | LA | 56.8 | 1 | 1000 | 15 |
| 2014-15 | Chi | 53.6 | 2 | 1005 | 12 |
| 2015-16 | Pit | 52.7 | 2 | 1006 | 8 |
| Average | 54.0 | 5 | 1006 |
Just something to think about as Columbus and Minnesota keep pushing their way up the standings.