

Jul 22, 2019
Is there too much offence from the defence in today’s NHL?
Defencemen are taking a higher percentage of shots than ever before, but there are some who could afford to be a little less trigger-happy, Travis Yost writes.
By Travis Yost

One of the questions I’ve wrestled with over the years is how to value individual offensive contributions from defencemen, particularly when it comes to goal scoring.
It’s an important subject because, much like forwards, there is a strong correlation between two components – usage (or, ice time) and scoring – and the contracts they will subsequently sign.
For forwards, it’s rudimentary but somewhat defensible. Most high-end forwards tend to be great individual scorers, and scoring for forwards is a much more repeatable talent. These players also tend to drive favourable goal differentials, which helps broadly justify the contracts they sign.
It’s a different animal for defencemen. We know that there is also variability in shooting talent with defenders, but it’s much more difficult to pin down.
There are a multitude of reasons for this but the most obvious is the fact that they are materially further from the net, on average, when they shoot. Since we know shot distance is a relatively strong predictor variable when assessing the probability of a goal being scored, we can easily conclude that defenders, on average, are far less likely to score a goal on a given shot relative to forwards. (Add to the fact that most high-end shooters are identified as forwards at a young age and you have an obvious talent disparity between the two groups.)
That’s nothing new. What is new is that the modern NHL defender is tasked with much more than just clearing pucks from the defensive zone. The league’s best defenders are competent in all three zones – they’re critical in suppressing zone entries and denying time and space defensively, they’re leaned on to lead breakouts and transitions through the neutral zone, and they’re counted on as a relief valve during offensive zone sequences.
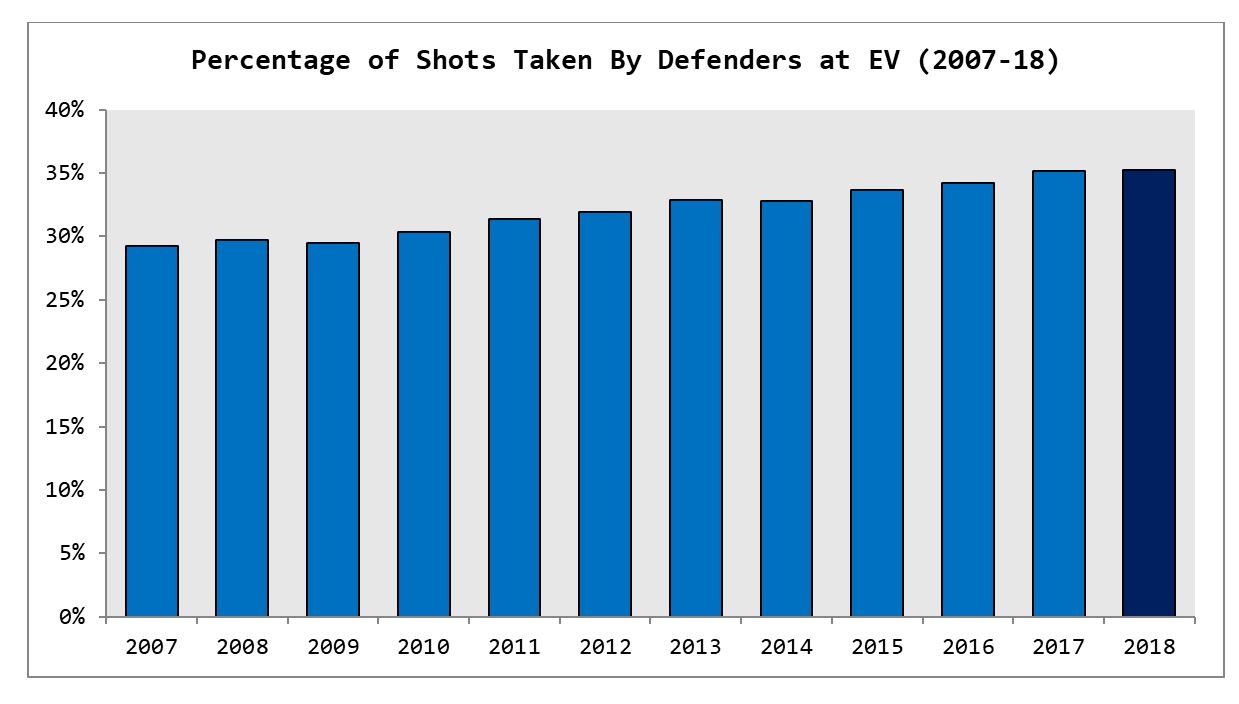
But as the modern defender does more, it comes with a possible opportunity cost – particularly if that defender just so happens to be a high-volume shooter. Across the league, defencemen are taking a higher percentage of shots than ever before, up about 10 per cent from a decade ago. That’s not necessarily a good thing or a bad thing in a vacuum (league wide shot rates are also up, as is goal scoring generally), but there has been considerable change observed within defencemen behaviour:
Defensive shot volume can help generate offence. Open shots with limited passing lanes can be desirable, particularly if the defender with the puck on his stick is a strong shooter. Those shots can also up rebound opportunities from deflections and/or redirects, which tend to carry higher conversion rates.
But there are also bad shots created. You don’t need me to point to examples of defenders firing wild slap shots from the point when sustaining the offensive zone pressure and continuing a cycle is probably the better option. In some of these cases, a low-percentage shot turns into a one-and-done opportunity, forcing the team to retreat and play defence.
Thinking about this further, I was curious as to see if there was a quick and easy way to isolate on defenders who are more prone to taking bad shots. There is, again, variability within the data, but we can pretty easily subset on the players who probably could afford to be a little less trigger-happy than they have been over the past two seasons (2017-19).
The average NHL defender carries a shot attempt shooting percentage of about 1.9, and the average NHL defender takes about 17 per cent of the shots available. For this exercise, we will look at all defenders meeting the following criteria:
- -1 standard deviation in shooting percentage
- +1 standard deviation in the percentage of on-ice shots taken
- -1 standard deviation in the relative impact they have on their teammates expected goals
- -1 standard deviation in the relative impact they have on their teammates actual goals
The latter two are important because some defenders are high-volume shooters but also create high volumes of shots for their teammates.
Take San Jose’s Brent Burns for example. Burns is taking nearly 31 per cent of San Jose’s shots while on the ice despite a shot attempt shooting percentage of 1.4. But he has a positive impact on his teammates expected and actual goals, largely due to the sheer volume of opportunities he creates. While we still may conclude Burns shoots too much, we can separately conclude he’s having a positive impact offensively.
Let’s look at the players where there is an opportunity for change:
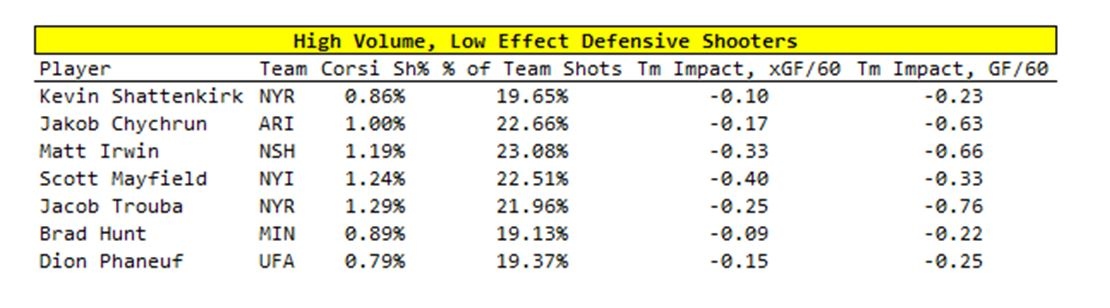
The point here is not to conclude that these defenders aren’t contributing, but rather that these seven names are players who are probably shooting the puck at a cost to their team’s overall offensive production.
The logical next step would be to look through the video – each player has taken a few hundred shots, or thereabouts – for a further understanding of the how and why. From there, you could validate or reject the theory that these players are probably a bit too trigger-happy when on the ice, and walk through examples where an offensive sequence died earlier than it should have because of low-percentage attempts.
The improvement in quality on the blueline over the last decade has been emphatic, and there’s no doubt the position carries much more of a 200-foot burden than it has historically. By and large, the talent influx and increased responsibilities have been good things.
But what’s true at a broader level may not be true at a micro level. When we see patterns emerge in the data, we need to understand all of the costs and benefits of those shifts. In the case of at least these seven skaters, it seems likely there is an opportunity for improvement.
And that might be just the tip of the iceberg.
Data via NaturalStatTrick and Evolving Hockey