


Dec 18, 2014
NHL teams take different paths to strong possession
Travis Yost examines some underlying factors in puck possession numbers, focusing on teams that generate and allow multi-shot shifts.
By Travis Yost

One of the more popular questions I get concerns how teams go about posting a great (or, poor) Corsi% -- a tabulation of shot-attempts at 5-on-5. We know Corsi% is meaningful because it virtually mirrors puck possession, and because shot-metrics like Corsi% predict future goal-scoring better than past goal-scoring does.
But no two teams are exactly the same. Roster make-up plays an integral role in how a team is able to territorially control play. An example I always like to give compares that of the Los Angeles Kings and San Jose Sharks -- two elite puck possession teams. Los Angeles can be a heavy dump-and-chase team at times. San Jose's generally perceived as more of a finesse club, opting to rush through the neutral zone with control of the puck. The two teams look like they're playing a different sport at times, but it's a different means to the same-end – owning the shot-differential battle, and consequently, owning the long-term goal-differential battle.
I've always thought that the most terrifying of hockey teams are those that can create and sustain offensive zone pressure after gaining the blue-line. Unfortunately, the NHL play-by-play data doesn't give us this, so we have to get a bit creative with our criteria if we want to look at how each team does in this specific area.
Ideally, we want to see a team generate two or more shot-attempts upon entering the zone. In order to pull this data out, we must have time constraints. Here, any instance in which two or more shot-attempts were recorded within 10-seconds of one another counts as a 'multi-shot shift'. No neutral or defensive zone event must occur between these shot-attempts – if it does, we know the puck has left the offensive zone. Any data immediately following an offensive zone face-off must also be eliminated, as will any instance in which there is a stoppage of play following the first shot-attempt. Not only can we observe efficiency at generating multi-shot shifts upon entry, we can reverse it and see how well a team does at avoiding those multi-shot shifts against.
First, let's look at the Eastern Conference. I've sorted by best percentage of multi-shot shifts to worst, so the teams on the left side are getting the better end of things here.
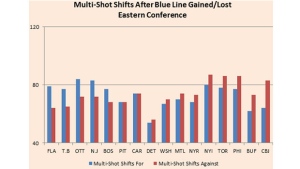
The fact that Florida's sporting the best differential of any team in the East is notable, but not surprising. The Panthers are well-above break-even in raw puck-possession at 51.2%, and it's certainly possible that their favorable percentage of multi-shot shifts is at least partially behind that run.
Ottawa's 28th in the league in control of play at 5-on-5 at 45.3%, but based on the above chart, we know the multi-shot shifts aren't doing them in. It seems likely that Ottawa's problem isn't tied up in a few ugly shifts per night, but rather losing the neutral zone with frequency.
Detroit and Toronto also stand out, but for different reasons. The Red Wings, for whatever reason, are playing a super low-event style of hockey here. They don't generate much of anything in terms of sustained pressure, but they don't let other teams cycle on them, either. Toronto, a historically dreadful puck-possession team, actually generates the fourth-most multi-shot shifts in the East. Unfortunately, they are also tied for the second-most against.
Now, let's look at the Western Conference through the same lens.
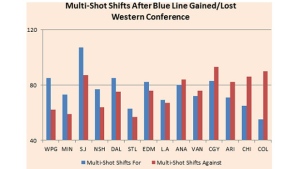
The most surprising team here, without question, is Chicago. Despite controlling a league-best 55.0% of play at 5-on-5, they are well in the red here. To me, it's the reverse of the Ottawa situation – the Blackhawks may not have a favorable amount of multi-shot shifts, but because the frequency in which they win the neutral zone is so high, the raw shot-differential numbers remain sterling.
Winnipeg owns the best percentage of multi-shot shifts of any team in the league, and this falls right in line with the team's measurable 5-on-5 improvement. On the other hand, Colorado's -35 differential is downright pitiful, comfortably dead last through the first third of the season.
Lastly, San Jose – the team we talked about off the top. It's always nice when the data bears out what the eye sees, and I'd say that's certainly true here. The Sharks have entered the offensive zone and generated multiple-shot shifts a league-high 107 times, nearly double that of 30th-place Detroit. This makes intuitive sense for myriad reasons: namely, the team is great at controlling play (52.1%) despite being a below-average neutral zone team. The key for San Jose is to get beyond the blueline. If they manage that, then the Sharks routinely run the opposition into the ground.