
Sep 24, 2015
Score effects provide critical context in stats analysis
Score-adjusted numbers provide the truest measure of team performance, TSN's Travis Yost writes
By Travis Yost

If there's one area where I'd like to see analytics make permanent in-roads at every level of hockey, it's the incorporation of score effects into our analysis.
Score effects are a well-researched and well-studied phenomenon. Teams with leads late in the game will often play to protect the lead and sacrifice most attempts at generating offence; teams trailing late will generally abandon their defensive structure in an attempt to equalize. It's an intuitive relationship, one that's a constant risk/reward bet for coaches and players.
This is far from a new or innovative concept, but it remains critically important in proper evaluation of performance. Ignore it and you're left with weak raw numbers that are blind to the behavioural and strategic realities at the core of the sport.
For example, consider Coach A and Coach B. Coach A's team just won a game 1-0 despite being outshot 30-10 and out-chanced 10-5. His team scored the winning goal in the final seconds of the third period. He is amazed his team emerged victorious.
Now consider Coach B. Coach B's team just won a game 4-3 despite being outshot 30-10 and out-chanced 10-5. However, Coach B's team also had a four-goal lead at the end of the first period. He is also amazed his team emerged victorious.
Are these two games identical? The goal differentials were the same. The shot differentials were the same. And the scoring chance differentials were the same.
But, these two performances are not equal. Coach A's team played in a score-close situation the entire game and were mostly dominated. Coach B's team jumped out to a massive lead and, predictably, went to the defensive shell to try and win the game.
Score effects bite hard on every team in the league, though to slightly varying degrees. Still we can observe the change in how teams play system-wide by just looking at shot generation and score state.
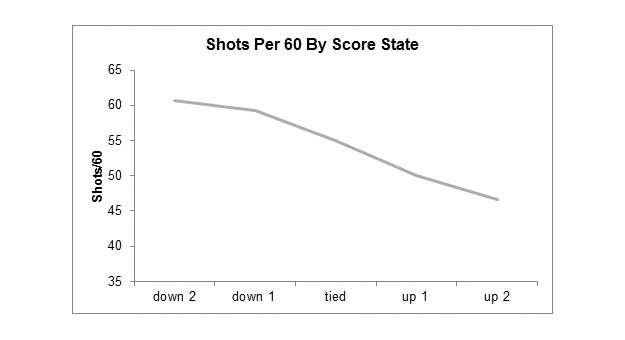
This graph, using numbers from 2012-2015, shows a pretty significant trend, and speaks to what we regularly observe with our eyes. Teams down, for example, two goals, are frantically trying to create offence (averaging easily a shot attempt per minute). Teams up two goals are far less likely to sacrifice defence for offence, and it shows – they generate about 25 per cent less offence than their down-two-goal counterparts.
So, what do we do with this information? The good news is we have nearly a decade of historical data for how teams play in different score states. Through this, we can weight any event (we'll focus on shots and scoring chances) based on likeliness of occurrence in a given score state. It will give teams more credit for generating shots and chances with a lead, and less credit for generating shots and chances from behind.
One other benefit to weighting shot and scoring chances by score state: We can start to really measure what kind of advantage these differentials will have as they pertain to goals. For example, let's look at shot differentials (score adjusted) over the past few seasons. What happens if you have a five-shot advantage at 5-on-5? How is it different from, say, a 25-shot advantage at 5-on-5?
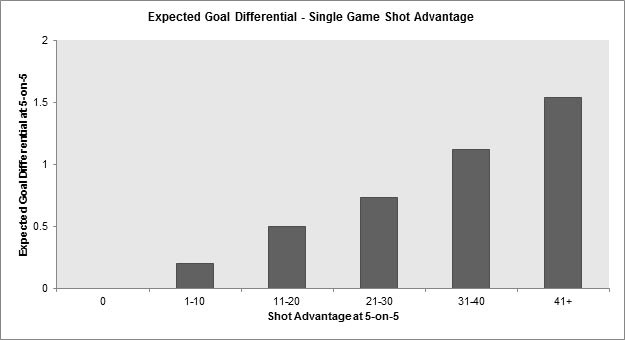
That's a devastatingly convincing trend if I've ever seen one. A team with a five-shot advantage at 5-on-5 expects to be about 0.25 goals better than their opponent, on average. But, a team with a 25-shot advantage (score adjusted) range is close to a full goal better than their opponent.
It's important to note that the same can apply to things like scoring chances. We can create the same adjustments based on frequency and score state, and observe a similar trend.
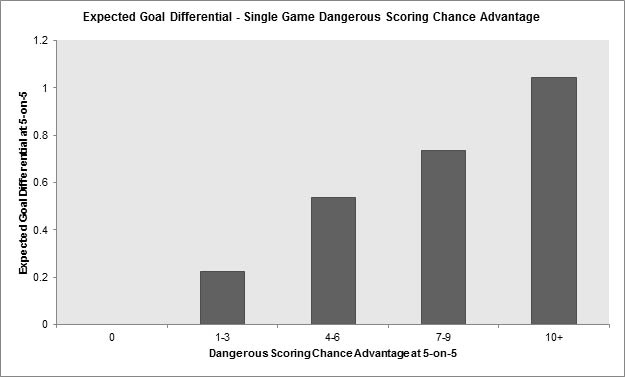
As you increase your scoring chance differential, you increase your expected goal advantage at 5-on-5. The same relationship we witnessed with shots, just on a slightly smaller scale.
Score –adjusted numbers on a single game basis are also automated, which gives executives and coaches even more reason to use those over raw counts. It's the only way an evaluator will be able to properly assess his team's performance on both ends of the spectrum.
The Takeaway
Score effects are a significant presence in the National Hockey League and can cloud any performance analysis. Failing to account for them can lead to dangerous and faulty conclusions (i.e. to win, it helps to be outshot). A team's score-adjusted numbers provide much more insight into a team's calibre of play regardless of the situation. The above graphs can also serve as a benchmark for the curious analyst who wants to know what shot or scoring chance differentials mean as they pertain to winning the goal battle – which, ultimately, leads to victories.