

May 7, 2015
Where have all the goals gone?
In three of the last four years, playoff goal-scoring has woefully lagged behind regular season goal-scoring – and this year, the disparity is considerable. Travis Yost looks into why goal-scoring rates have crashed in this year's NHL Playoffs.
By Travis Yost

Where has all the goal-scoring gone?
That seems to be the big question this postseason – partially because the drop-off is so glaring, and partially because a couple of the second-round match-ups are so lopsided, attention has shifted to the quality of play.
First off, it’s important to note that the goal-scoring thing is a very real development. This isn’t some issue that’s been brought to the surface after a couple of odd 1-0 games. In three of the last four years, playoff goal-scoring has woefully lagged behind regular season goal-scoring – and this year, the disparity is considerable.
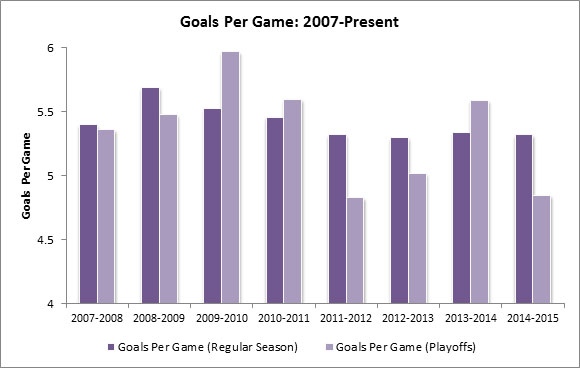
It’s certainly possible that this year’s a bit of an outlier, though it’s hard to ignore that more or less the same thing occurred in 2011-2012 and 2012-2013. Through Wednesday’s games, goal scoring sits well under 5 goals per game, despite the regular season averages sitting well above that number.
What’s causing the decline in goal-scoring? I think there are a number of contributing factors, some of which were addressed by James Mirtle at The Globe and Mail last week. The piece is an interesting look-in at how the referees’ tendency to ‘swallow the whistles’ in the post-season has led to fewer power-play chances – an area where teams can score goals in bunches.
There are at least two other factors at play here. One, and I think this is just the reality of where the game of hockey has developed over the years – goaltending talent, despite tweaks made by the competition committee over the years, is passing by skater talent. Year after year, we see both regular season and playoff save percentages rise, and this year’s crop of playoff goaltenders have a real shot at breaking the average playoff save percentage record (92.3%). Even compared to recent seasons, this year’s goaltenders stand out:
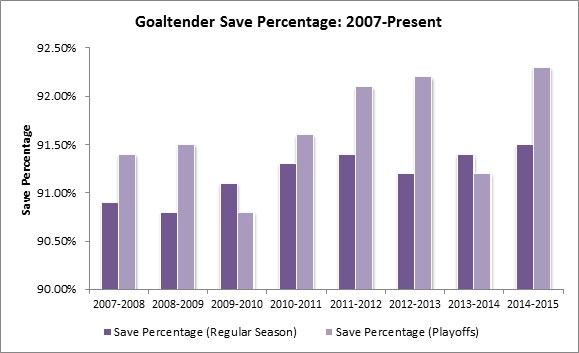
Both regular season and playoff save percentages are on the move upwards. Again, I think a lot of this can be allocated to the fact that the goaltending talent right now is as good as it has ever been. It’s hard to ignore the fact that three of the eight remaining netminders – Carey Price, Henrik Lundqvist, and Braden Holtby – have been consistently fantastic year over year against thousands of shots at the National Hockey League level. Even away from them, you have lesser names like Ben Bishop (93.3%) and Frederik Anderson (92.7%) looking great in their own right.
Secondly, it’s hard not to watch any given game and notice how much time is spent in the never-ending neutral zone chess match. Unless they’re chasing a goal late in a game, teams are very hesitant to take a gamble or two in the middle of the ice – whether that’s attempting to enter the zone with control to make a creative play, or whether that’s to aggressively harass a puck-carrier as you defend the middle of the ice. For the most part, teams really appear to prefer the safe, if ineffective, option over all other alternatives. It leads to an awful lot of dump and chase, and an awful lot of panicked clearing of the defensive zone as opposed to controlled zone exits.
That, of course, is a bit anecdotal. But, there are numbers that support this theory. For example, not only are the goals per game down, but scoring chances per game are down, too.
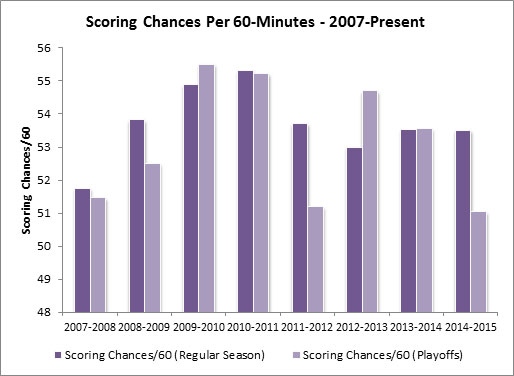
You might not get everyone to admit it, but it hasn’t been a banner offensive year for the National Hockey League. Using the data, and scoring chance definition, from War on Ice, the above table is yet another reason why scoring is down league-wide – there just aren’t nearly as many shots coming from the ‘home plate’ area as compared to years past.
The most concerning thing is that this year really doesn’t have a true comparable. You might initially look at 2011-2012, where the regular season scoring chances and playoff scoring chances look nearly identical. Then, you might recall the teams that made headway that post-season. Of the eight teams that won at least one round, only one – the Phoenix Coyotes – played at a considerably above-average pace. Many of the teams were either low-event or super-low event by nature.
That’s not the case this year. Six of the eight teams remaining played at either an average pace or above-average pace in the regular season, led by the Chicago Blackhawks and Calgary Flames. And yet, here we are – these same ‘high event’ teams playing ‘low event’ hockey in the post-season.
Will we see a change in round three? Perhaps. The teams with 3-0 series leads in round two – Tampa Bay and Chicago most notably – had little problem scoring during the regular season, and the same can be said for whoever advanced out of the Washington/New York and Anaheim/Calgary draw.
Get the right matchups, and maybe, just maybe, we’ll see a few more red lights.