
Aug 20, 2015
Why analysis of goalies is so difficult
When it comes to statistical analysis of forwards and defencemen, there are plenty of ways to break down value beyond goals and assists. But for goalies, the most useful stat is save percentage, and it's one that is swamped by random variance. TSN's Travis Yost breaks it down.
By Travis Yost

Last May, a team executive asked where I thought statistical analysis was having the biggest impact at the NHL level. A few answers came to mind, but I immediately mentioned that I thought our valuation of defencemen – especially puck-moving defencemen – had rapidly improved.
It's not a coincidence that a few days later, I wrote about how the Tampa Bay Lightning stealing of Anton Stralman out of free agency was paying huge dividends. Stralman is something of an ideal case, but it does capture the essence of what paying attention to the underlying numbers can do for a team. He never had lofty counting numbers and wasn't the most physical presence on the ice, but his impact on the possession game was indisputably strong. With that, of course, come the goal differentials that win games.
One other question: he asked where I thought statistical analysis was struggling. This was a much easier answer, and it's a topic that gets a lot of play around the blogosphere.
We haven't figured out goaltenders.
There are myriad problems with the position, especially as it pertains to predictive analysis. The biggest driver is that save percentage – perhaps the best metric we have for capturing a player's ability to stop shots – is swamped by random variance, team effects and (potentially) sample size issues that kill any hope at meaningful confidence intervals. It leads to very little repeatability in goaltender performance, which makes it a struggle to forecast what many players will do in upcoming years. So, while we might be able to speak with confidence about Henrik Lundqvist and Tuukka Rask in future years, it doesn't say much for the other 25 guys manning their creases.
It's undoubtedly an area that needs significant improvement on our end. Part of that is work related, part of that is that it will naturally improve as better tools (player tracking!) become available.
But, it's important to note that there's another entity that struggles miserably with goaltender valuation: general managers.
To start, there's either no rhyme or reason to how goaltenders develop, or teams do a very poor job of scouting talent. I'm inclined to believe it's a mixture of the two – the position, generally, being complex in nature, and the eye test failing us in ways it may not with goal-scoring forwards.
But, there's also no discernible pattern between performance and pay. And that's the most troubling part.
Let me show you a quick example. If I were to show a scatter plot of each forward's AAV ($) and each forward's point totals in a single year, would you expect to see a relationship? I would. And the data supports that.
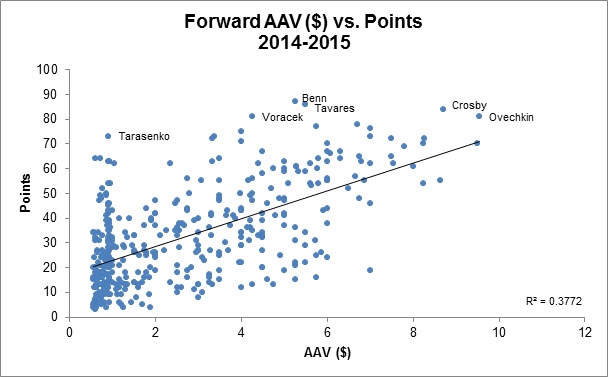
Even with the NHL's current salary cap setup (specifically cheap first and second contracts conflating things), the relationship is pretty clear. Our linear trendline rises as we move left to right, signifying that higher paid players are more likely to score more points. This seems like an obvious point, but it's an important one for the sake of this piece – teams, for the most part, have done a nice job of identifying and subsequently paying players who consistently score at a high level.
Back to goaltending. What if we did the same exercise, looking at AAV ($) against even-strength save percentage? Would we see the higher paid goaltenders stopping a higher ratio of shots in a given year?
Quick answer: no. There is virtually no relationship between a goaltender's AAV ($) in a single year and his even-strength save percentage in that same year.
However, one might argue that even-strength save percentage –the most repeatable goaltender metric we have at our disposal – is not the best for comparing AAV ($) and performance in a given year. So, let's bring in War on Ice's goals above replacement metric (simply defined as a goaltender's contributions to his team measured in goals above "replacement level") and run the same exact analysis. And, since we have a smaller pool of goalies, I'll pull data for the three most recent full seasons.
Do teams look any better here?
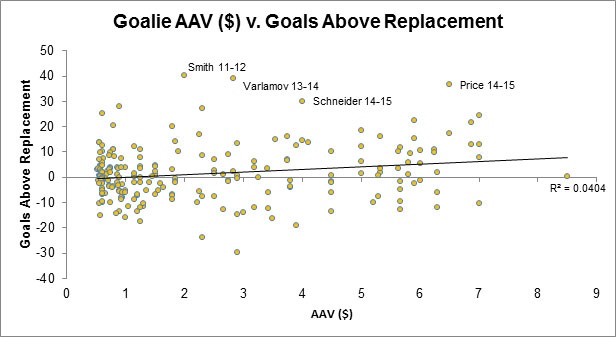
The trendline here is extremely flat, which signifies that an increase in AAV ($) does not signify any real increase in performance. If you are asking yourself why goaltenders are given out such lucrative contracts year after year, you are not alone. It feels little more than an exercise in dart throwing for maybe 25 of the 30 starting goaltenders. Case in point: the goaltender with the highest goals above replacement over the last three full seasons is Mike Smith in 2011-2012 (a whopping 40.2 goals better than a replacement level goaltender). How has Mike Smith looked since then? In a word, subpar.
The Takeaway
Goaltenders are voodoo. Statistical analysis has proved only mildly helpful as it pertains to identifying goaltending talent and forecasting future performance. Teams also struggle mightily with goaltender evaluation – from the time of the draft, to the time in which they decide to fork over the first (or second) lucrative contract. Down the road, technological improvements may pay significant dividends here, as metrics will be crafted to better identify goaltending talent, and separate skill from the noise.