


Dec 2, 2014
Yost: How does a power play sustain success?
While many hockey analysts appear to obsess over raw conversion rates, Travis Yost finds that shot generation is far more predictive of future success (or failure) than shooting percentage.
By Travis Yost

If you had two sets of data, one being a team’s shooting percentage, and the other being a team’s ability to generate shot-attempts, which set would be better in terms of predicting future 5-on-5 goal-scoring ability?
At first blush, one may guess the former. After all, it gives us the percentage of shots on net that result in a goal. The latter set of data only tells us how frequently shots are generated, and tells us little – if anything – about a team’s goal-scoring ability.
But, that’s not the case. Plenty of work has been done on this topic, particularly at even-strength. The answer is clear: shot-attempt metrics and puck possession proxies like Corsi are much more predictive than shooting percentage, primarily because shooting percentage is swamped by random variance.
It’s important to note that this also holds true for special teams. While many hockey analysts appear to obsess over raw conversion rates, the same above principle – that shot generation is far more predictive of future success (or failure) than shooting percentage – is vital in forecasting future success.
Why? Because shooting percentage, even in a power-play situation where scoring chances are aplenty, is not a very repeatable skill. It’s easy to illustrate this by simply grabbing a team’s shooting percentage over the first half of the season, and finding how well it correlates to the team’s shooting percentage over the second half of the season.
Taken from the years 2007 through 2011:
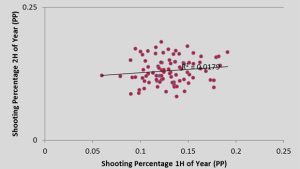
I included the coefficient of determination (0.01) – or percent of variance explained – to illustrate the randomness in shooting percentage. As you can see, a team’s 5-on-4 shooting percentage through the first 41 games of the season does nothing in terms of telling us how well it will convert on shots over the next 41 games.
Shot-attempt generation, we know, is a repeatable 5-on-5 skill. Does the same hold true for 5-on-4? Let’s grab the CorsiFor/60 for the same teams in the above sample, and see if their first-half numbers and second-half numbers show similarity.
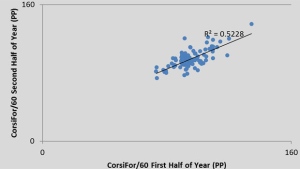
The graph and coefficient of determination here are much more convincing. A team’s ability to generate (or not generate) shots through the first 41 games will likely carry over to the next 41 games, which means this particular measurement has predictive value – far more than, say, shooting percentage.
More than anything else, I think this topic is timely. If you poll members and fans of the National Hockey League as to who the league’s deadliest power-play is right now, I think you’ll get a stunningly similar response in the Pittsburgh Penguins. Now, that’s a decent choice – they have a ton of talented forwards, they have exhibited ability to generate shot-attempts with frequency in every game-state, and they have puck-movers on the back-end who can whip the puck through the neutral zone with tempo. All of that is fantastic
However, the primary reason I think most would select the Pittsburgh Penguins right now is conveniently tied into the fact that they’ve converted on 31.6% of their power-plays through a 17.54% shooting percentage, second-highest in the league.
But, if we are trying to forecast future outcomes, we know to move away from shooting percentages and gravitate towards shot generation. How do the Pittsburgh Penguins look in that aspect of the game?
Power Play CorsiFor/60
| Rank | Team | CorsiFor/60 |
|---|---|---|
| 1. | Washington Capitals | 127.7 |
| 2. | San Jose Sharks | 114.3 |
| 3. | Arizona Coyotes | 113.9 |
| 4. | Philadelphia Flyers | 106.2 |
| 5. | Chicago Blackhawks | 104.2 |
| 6. | Toronto Maple Leafs | 102.5 |
| 7. | Winnipeg Jets | 102.3 |
| 8. | Detroit Red Wings | 101.5 |
| 9. | Boston Bruins | 100.9 |
| 10. | Ottawa Senators | 96.8 |
| 11. | New York Rangers | 95.2 |
| 12. | Pittsburgh Penguins | 95.1 |
In reality, what we have in Pittsburgh is a good power-play with elite scoring talent. I’m highly skeptical, however, that it’s going to be the best unit by the end of the season, because it still pales in comparison to the units established in Washington (currently 28.8% conversion rate; 2nd) and San Jose (currently a 23.8% conversion rate; 4th), both historically and through the first leg of 2014-2015.
Washington’s power-play has been performance art for years, and if nothing else, these early season numbers show the kind of incredible ability they have at blitzing opposing penalty kill units. Their scheme starts with a series of well-designed neutral zone rushes, and almost always features the likes of Nicklas Backstrom and Marcus Johansson on the right-side of the ice, with Alex Ovechkin waiting in his one-time wheelhouse for cross-ice passes.
Backstrom and Johansson generally engage in sequences of back-and-forth passing to draw the defense deeper towards their own crease, which sets up two other options away from the Ovechkin primary at the blueline. If the defense pays too much respect to Ovechkin, Mike Green, John Carlson, and Matt Niskanen hammer away from the point. And if the defense pays equitable respect to the point shot and Ovechkin, Backstrom and Johansson needle their way deeper into the box of the penalty kill.
If teams are looking at ways to improve their power play through modelling the attacking styles around the league, they could do worse than Mike Johnston’s Pittsburgh Penguins. But, right now, the kings of 5-on-4 still reside in the D.C. area.
And, the king of predictive utility for power-play performance is still embedded in shot attempts.