
Nov 13, 2014
Yost: Oilers are taking positive steps
Travis Yost examines the Edmonton Oilers and indications of progress early in the 2014-2015 NHL season.
By Travis Yost

The below table contains a group of five first-line centres in the National Hockey League, with their Corsi% On (percentage of 5-on-5 shot attempts with the player in question on the ice) and Corsi% Off (percentage of 5-on-5 shot attempts with the player in question off of the ice). I’ve omitted names in an effort to temporarily mitigate bias.
First-Line Centres
| Centre (2014-15) | Corsi% On | Corsi% Off |
|---|---|---|
| Player A | 55.3% | 46.6% |
| Player B | 53.8% | 50.7% |
| Player C | 58.5% | 48.9% |
| Player D | 56.0% | 47.7% |
| Player E | 53.4% | 48.7% |
I think we can comfortably agree that these five players share two things in common: one, their respective teams are in control when they’re on the ice, and two, there is depreciable performance when they come off of the ice. It’s important to note, though, that the Corsi% Off for each of these centres isn’t terrible – it’s actually at or around what we would expect for a weighted performance of lines two, three, and four based on prior work done at HockeyGraphs
The point isn’t that these players are likely great at their craft. It’s that these players likely play on teams with at least fairly competent depth, perhaps enough to compete for a playoff spot.
Let’s work this exercise one more time. We’ll focus on the same five centres but, this time, grab their Corsi% On and Corsi% Off for the years 2011-2014.
First-Line Centres - On and Off Ice Corsi%
| Centre (2011-14) | Corsi% On | Corsi% Off |
|---|---|---|
| Player A | 57.7% | 49.0% |
| Player B | 50.2% | 47.9% |
| Player C | 54.7% | 47.7% |
| Player D | 56.5% | 50.6% |
| Player E | 47.2% | 44.3% |
for Player A through Player D, we see more of the same – a range from very good to elite possession numbers via Corsi% On, and mostly average possession numbers based on line expectations via Corsi% Off. Player E, however, is substantially different. He was getting caved in by the opposition, and his team was just appalling with him on the bench.
Players A through D, in order: Henrik Sedin, Nicklas Backstrom, Sidney Crosby, and Joe Thornton. As you might have expected. Player E? Ryan Nugent-Hopkins.
Though there’s been a lot of handwringing about another possible disappointing season in Edmonton, I think there’s something to be said about measurable improvement. I know Oilers fans – and probably the front office and coaching staff, too – dream of this team making a magical jump from draft lottery quality to legitimate playoff contender overnight. Unfortunately, progress often takes time. That’s especially true if you’re trying to build a team that can hang its hat on puck possession, and not riding the wave of variance to a fluky post-season berth.
And make no mistake, Edmonton has improved at 5-on-5. Part of it is because Ryan Nugent-Hopkins and his linemates seem to be finally taking the next step, entering their playing primes as a group. Part of it is because Edmonton has done an excellent job at repairing some galaxy-sized holes in the lineup away from the top-line, enough that this team is no longer pulling dreadful 44% control with their top players off of the ice.
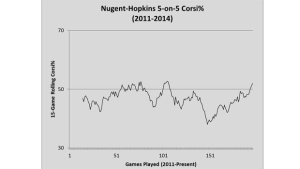 Let’s touch on Ryan Nugent-Hopkins first. We know he’s still towing positive RelativeCorsi% from the numbers above. Additionally, he – with assistance from Taylor Hall and Jordan Eberle, certainly – is on the verge of hitting a Corsi% he’s only seen a couple of times previously in his career. The graph to the left is a 15-game rolling average, which will let us capture his recent 2014-2015 uptick.
While Nugent-Hopkins and the Edmonton top-line are starting to decisively control play, it’s not exactly uncharted territory – we have seen stretches, albeit brief ones, of that top-line clicking in the past. What’s made Edmonton respectable, again, is that the second, third, and fourth line are starting to pull their weight a bit, something that’s been as elusive as winning within the Oilers organization for years now.
We can use the same 15-game Corsi% rolling average for the Oilers over all of the games Nugent-Hopkins has played, but specifically exclude all of the shifts in which Nugent-Hopkins was on the ice. How does Edmonton look now compared to years past?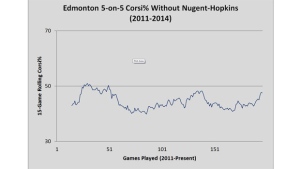
Just like Ryan Nugent-Hopkins, the Oilers second, third, and fourth-lines have seen brief stints of respectability before. But, compare the first graph to the second graph, and you’ll notice that this team’s never really had both groups going at the same time. When Nugent-Hopkins was struggling early in his career, the rest of the Oilers group was doing OK. When Nugent-Hopkins had a great run during the lockout-shortened year, the rest of the Oilers lines couldn’t get out of their own way.
Can Edmonton sustain this sort of success? Right now, the team sits at 48.5% Score-Adjusted Fenwick% through sixteen games – ranking 21st in the NHL. It’s only a start, but let’s remember the Edmonton teams of past, and their league-wide ranking by Score-Adjusted Fenwick%: 28th, 26th, 30th, 29th, 26th, 29th, and 28th.
Improvement is a relative term. Edmonton’s doing it. In the event that they can fix the goaltending that’s really been the source of their pain for most of this season, the Oilers could be a team trending up in the standings.