
Sep 25, 2014
Yost: Poster boys and punching bags of analytics
From Jack Johnson to David Bolland and from Jakub Voracek to Mikael Backlund, they are the punching bags and poster boys of analytics. TSN.ca's Travis Yost provides his lists of the top 10 in each category and why, in particular, Andrew MacDonald, Ryan Callahan, Chris Tanev and Jimmy Howard deserve to be singled out.

From Jack Johnson to David Bolland and from Jakub Voracek to Mikael Backlund, they are the punching bags and poster boys of analytics. TSN.ca's Travis Yost provides his lists of the top 10 in each category and why, in particular, Andrew MacDonald, Ryan Callahan, Chris Tanev and Jimmy Howard deserve to be singled out.
Analytic Poster Boys: Players whose actual value exceeds perceived value
1. F Jakub Voracek, Phi: Excellent scorer, quietly a massive positive possession player at even-strength.
2. D Marc-Edouard Vlasic, SJ: Blueline rock has morphed into reliable first-pairing type at reasonable cost.
3. F Max Pacioretty, Mon: Only Ovechkin, Kane & Neal had more shot attempts than Pacioretty last 3 years.
4. F Patrice Bergeron, Bos: Almost certainly the best two-way forward in the sport. Enough said.
5. D Mark Giordano, Cgy: Giordano led Calgary to respectable offensive zone time numbers in Norris-calibre 2013-2014.
6. F Benoit Pouliot, Edm: Among 16 forwards to have Goal% in excess of 60% over last 3 years. Same class as Toews & Crosby.
7. G Jimmy Howard, Det: Excellent even-strength goaltender who looks like lock to bounce back in 2014-2015.
8. D Chris Tanev, Van: Numbers suggest reliable, effective (and underrated) top-four defender.
9. F Mathieu Perreault, Wpg: Quality possession player with gift for generating shot attempts in home plate scoring area.
10. F Mikael Backlund, Cgy: Only 1000-plus minute forward on Flames to record better-than-even Corsi% (51.4%) last 3 years.
Analytic Punching Bags: Players whose perceived value exceeds actual value.
1. D Jack Johnson, CBJ: Columbus significantly better team with JJ off the ice since assuming top-four role.
2. D Andrew MacDonald, Phi: A magnet for consistently negative shot and goal differentials.
3. G Jonathan Quick, LA: Cup- and Conn Smythe-winning goalie just 14th in EVSV% last 3 years.
4. F Tyler Bozak, Tor: A passenger who has earned first-line role as by-product of Kessel's success.
5. G Marc-Andre Fleury, Pit: EVSV% last 3 years sits behind Neuvirth, Garon, Budaj & Bryzgaolov.
6. D. Brooks Orpik, Was: Defensive defenseman ineffective at deterring scoring chances or zone time against.
7. F Ryan Callahan, NYR: Decent, hard-working second-line winger paid to contribute like a top-tier goal-scorer.
8. F Milan Lucic, Bos: Negative possession player in Bruins even-strength machine.
9. F Chris Stewart, Buf: Weak 5-on-5 player whose only discernible value is raw shooting talent.
10. F David Bolland, Fla: A third or fourth line center being paid to log first or second line minutes.
Anlaytic Punching Bag: F Ryan Callahan, Tampa Bay Lightning
Ryan Callahan seems to be the player that every hockey executive likes. He gives fantastic effort, he plays physical, he’s got a decent skill set, and you sense he’d rather die than lose a hockey game. These all, of course, are desirable qualities. And yet, many of them are intangible in nature. It doesn’t render any of the above meaningless. But, if a player’s effort and physicality and will to win are so prominent, they’d likely factor into his underlying numbers.
Therein lies the problem with Ryan Callahan. His underlying numbers scream mediocrity, particularly so for a player who the Tampa Bay Lightning decided to give a six-year, $34.8 million contract to this summer. That’s first-line winger commitment, though I’m extremely skeptical Callahan will ever produce to the level commensurate to his pay.
Let’s really isolate on the forwards from 2011-2014 who compare closely to Ryan Callahan’s level of production. I circled a bunch of forwards with similar Corsi%, Goal%, and per-sixty scoring rates, along with individual per-sixty shot-attempt rates. This is where Callahan sits:
Anlaytic Punching Bag: Callahan
| Player | Corsi% | Goal% | Points/60 | Indiv. Attempts/60 |
|---|---|---|---|---|
| Jason Chimera | 48.3% | 49.5% | 1.7 | 14.1 |
| Erik Cole | 49.4% | 49.5% | 1.6 | 14.8 |
| Jamie McGinn | 48% | 47.1% | 1.6 | 14.5 |
| Mason Raymond | 47.3% | 48.7% |
1.6 |
13.2 |
| Ales Hemsky | 48.9% | 46.7% | 1.5 | 12.5 |
| Ryan Callahan | 49.6% | 50.5% | 1.5 | 15.5 |
| Michael Frolik | 53.1% | 49.7% | 1.5 | 17.0 |
| Lauri Korpikoski | 46.7% | 48.4% | 1.5 | 13.6 |
| Antoine Vermette | 49.7% | 50.5% | 1.5 | 10.0 |
| Daniel Winnik | 50.3% | 49.7% | 1.4 | 13.1 |
| T.J. Galiardi | 50.0% | 42.9% | 1.2 | 13.4 |
| Tomas Kopecky | 49.3% | 43.4% | 1.1 | 13.2 |
I think this is a decent crop of comparables for Callahan. As you can see, there’s no real difference in any of these players – well, except for salary. Other than maybe Shane Doan and Erik Cole, most of these guys are signed to fairly reasonable contracts. None compare to Callahan’s individually, of course.
Naturally, it’s tough to figure out how Callahan took Tampa Bay for so much money. If the intangible aspect of Callahan’s game was so impactful, we’d likely see something better than more or less breaking even in the shot and goal department for three years – on good hockey teams, too.
Analytic Punching Bag: D Andrew MacDonald, Philadelphia
I thought about not even including MacDonald in this piece, because he’s a player the analytics community has been sort of hounding with a relentless fury that only Columbus Blue Jackets defenseman Jack Johnson probably knows.
The problem with MacDonald is simple: his team is exceptionally better with him off of the ice than on. This is, as you’d anticipate, abnormal for well-paid, big-minute defenders. We can illustrate this in the most basic of graphs, a Corsi On v. Corsi Off comparison for Andrew MacDonald over the last three seasons.
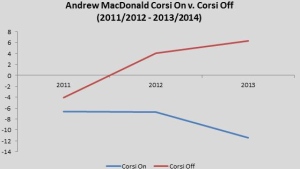
Reading this is pretty simple: MacDonald’s teams at even-strength were significantly better with him off of the ice, and significantly worse with him on the ice. MacDonald was basically a magnet for opposition territorial domination.
What makes this particularly concerning is that it’s hard to come with a legitimate defence for why MacDonald was so bad. He started over 48% of his shifts in the offensive zone over this stretch, a higher number than fellow defenders Marc-Edouard Vlasic, P.K Subban, and Oliver Ekman-Larsson. His competition level (a weighted metric that takes into consideration the Corsi% of all opposition faced) was higher than average, but failed to crack the top-forty, and ranked lower than names like Duncan Keith, Victor Hedman, and Drew Doughty.
I think there’s a fascinating discussion to be had about how to optimize Andrew MacDonald going forward, but I’m almost certain it doesn’t involve playing first-pairing minutes through the 2020 season.
Analytic Poster Boy: D Chris Tanev, Vancouver Canucks
Chris Tanev’s an interesting player in that his underlying numbers scream full-time, top-four NHL defender, and yet the Vancouver Canucks appear a bit reluctant to commit to him long-term. I think part of it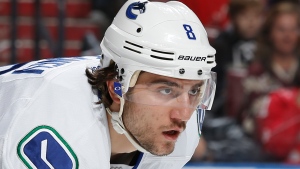 is due to the fact that he only has one full year of NHL experience, and the other part of it is probably tied into him sitting behind names like Alex Edler, Kevin Bieksa, and Dan Hamhuis. All three of those are household names. Chris Tanev, on the other hand, went undrafted and has logged all of 156 games at the NHL-level.
The last three years of Tanev have been quietly excellent, though. Let’s go ahead and grab a quick list of defenders who have played at least 2000-minutes at even-strength over the last three years. We will set three parameters: the defender must have enjoyed better than break-even possession (i.e., a Corsi% above 50%), the defender must have enjoyed better than break-even goal-scoring (i.e., a Goal% above 50%), and the defender must have been a decent point-producer -- the average NHL defender from 2011-2014 averaged about 0.70 points per sixty minutes, so we will set our floor there.
If we isolate for defensemen who only meet the above criteria, who are we left with?
Poster Boy: Tanev
| Player | Corsi% | Goal% | Points/60 |
|---|---|---|---|
| Zdeno Chara | 56.4% | 60.5% | 1.0 |
| Erik Karlsson | 55.1% | 52.1% | 1.5 |
| Slava Voynov | 55.1% | 55.7% | 0.9 |
| Nick Leddy | 54.9% | 52.3% | 0.9 |
| Kevin Shattenkirk | 54.8% | 57.1% | 1.0 |
| Brent Seabrook | 54.5% | 55.1% | 1.0 |
| Alex Pietrangelo | 54.3% | 56.4% | 1.0 |
| Matt Niskanen | 54.1% | 59.8% | 1.0 |
| Duncan Keith | 54% | 54.7% | 1.1 |
| Kimmo Timonen | 54% | 52.5% | 0.9 |
| Dan Hamhuis | 53.4% | 58.7% | 0.9 |
| Jakub Kindl | 53.3% | 59% | 0.9 |
| Niklas Hjalmarsson | 53.1% | 53.9% | 0.8 |
| Dan Boyle | 53.1% | 53.2% | 0.8 |
| Joe Corvo | 53% | 52.7% | 0.9 |
| Niklas Kronwall | 52.9% | 51.2% | 0.8 |
| Paul Martin | 52.6% | 51.3% | 0.8 |
| Kris Letang | 52.5% | 58% | 1.4 |
| Kevin Bieksa | 52.5% | 51.7% | 0.9 |
| Jason Demers | 52.4% | 50.3% | 0.8 |
| Alex Goligoski | 52% | 53.6% | 1 |
| Christopher Tanev | 52% | 57.9% | 0.7 |
| Keith Yandle | 51.8% | 51.7% | 1.1 |
| P.K. Subban | 51.2% | 55.1% | 0.9 |
| Ryan McDonagh | 51% | 55% | 0.9 |
| Oliver Ekman-Larsson | 50.5% | 52.9% | 0.9 |
| Victor Hedman | 50.3% | 52% | 1.2 |
This is where Tanev shines. With Tanev on the ice over those 2000-minutes, Vancouver earned 52% territorial control and nearly 58% of the goals. And, the decent scoring rate further suggests he’s positively involved in the run of play. Now, look at his comparables based on the parameters established. It’s a group of first-pairing defenders and/or first-pairing defenders who have won a Norris Trophy.
Any bets on whether or not Vancouver’s going to have to pay a lot more next summer, when they are back at the negotiating table with Tanev’s agent?
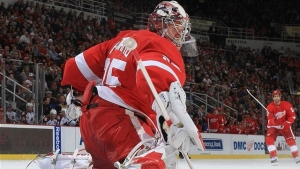
Analytic Poster Boy: G Jimmy Howard, Detroit Red Wings
Jimmy Howard’s been recognized as a respectable starting goaltender for years now, but I think some ignore just how impactful he’s been for the Detroit Red Wings over the years. The team’s aging process hasn’t been kind to some of their star players over the years, and I anticipate that they are going to have to rely a bit more on their goaltending prowess until they get back to where things once were at five-on-five.
 Howard, like Tanev above, compares extremely well to his peers over the last few seasons. In fact, other than the venerable Tuukka Rask and Henrik Lundqvist, no active goaltender with at least 2,400 minutes logged over the last three seasons has enjoyed a better even-strength save percentage than Jimmy Howard. For quick comparisons, note that Howard’s .936 fellow Team USA goaltenders Ryan Miller (.926) and Jonathan Quick (.931) both trail the Red Wings netminder.
Now, Howard did experience a bit of a drop in performance in 2013-2014 by raw SV%, chiefly due to his .866 penalty kill SV% burying a very respectable .931 EVSV%. But, knowing what we know about the volatility of special teams and goaltenders’ regular regression to the averages on the penalty kill, we can assume that Howard’s middling 2013-2014 SV% will likely return to his 2011-2012 and 2012-2013 numbers -- primarily because he’s still such a rock at even-strength.