
Aug 30, 2019
‘Carriers’ and the ‘carried’ unduly affecting their teams
Despite so much talent throughout the NHL, there is still a rather sizable gap in a team’s performance – for better or worse – when certain skaters are on and off the ice, Travis Yost writes.
By Travis Yost

Earlier in the week, I was asked what singular stat would best define the Connor McDavid era in Edmonton. The answer was easy: it’s the seismic shift in Edmonton’s performance when McDavid is on the ice versus off.
From 2015-19, the Oilers have outscored their opponents 271 to 218 at 5-on-5 with McDavid on the ice. Unitized for usage, Edmonton is a whopping 0.7 goals better than their opponents for every 60 minutes McDavid plays at 5-on-5.
Then there is the other side of the coin. The Oilers have been outscored 446 to 338 at 5-on-5 in the remaining minutes. Unitized, that means the Oilers are -0.6 goals worse than opponents for every 60 minutes McDavid does not play. This doesn’t take into account teammate effect just yet, but does serve to illustrate how disparate performance is within the two groups.
The McDavid splits have been exhausted at this point and aren’t news to even the most casual observers of the sport. But it is fascinating in the modern era – a modern era that’s hallmarked by more playing talent available than ever before, fewer roster slots being allocated to enforcer-type players who don’t drive performance, and so on – that such chasms can exist.
(As an aside, this is why I struggle so much with how we weigh Hall of Fame voting criteria. I believe team accomplishments do matter, but to what extent? It’s certainly not McDavid’s fault that the Oilers have built lottery team after lottery team from lines two through four.)
But McDavid isn’t the only player in this boat. Despite so much talent around the league, there still exists a rather sizable gap in performance when certain skaters are on and off the ice. I like to refer to them as the carriers and the carried – the players who are disproportionately affecting their teams, for better or worse.
Let’s start with defining the carriers and the carried. One of the first things we need to do is look at the distribution of how team performance is impacted by a given player on relative terms. For skaters, I like to consider how a player affects actual goals for and expected goals against. Why expected goals against? Because actual goals against is much more reliant on goaltender performance, which is generally outside of the control of the skater itself. (Alternatively: defensively, we should value the ways in which skaters can suppress both shot volume and the quality of those shots. Stopping the pucks is up to the goalie.)
Over the last two years, for regular skaters, this is what the distribution looks like:

From the distribution, we can start isolating on outliers – the players that fall on either ends of the tail, so to speak. Two standard deviations from the average would see players who are +/- 0.68 goals per 60 minutes better (or worse) than their peers. Since that’s about 2.5 per cent of the player pool on each side of the coin, we can start defining what players are carrying a heavy load for team performance, and which players are dragging down team performance in a similar manner.
Let’s start with the carriers. We know McDavid’s going to be in this group, but interestingly he isn’t at the top of the list. That honour belongs to Vegas Golden Knights winger Mark Stone. Stone, like McDavid, spent most of the last two years playing on a painfully top-heavy team. But even on a much deeper Vegas team, Stone was still the team’s best producer, and his relative numbers were still sterling:
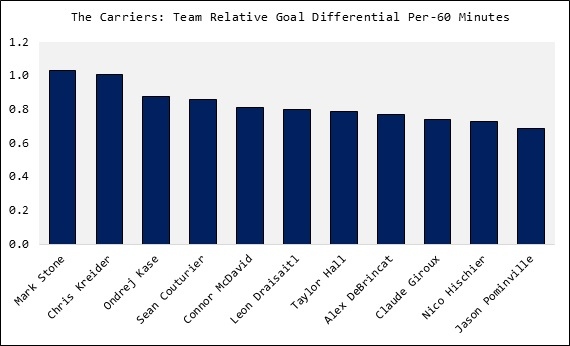
Every player has had a slightly different experience but I think you can segment this group as follows: (a) talented skaters; (b) skaters playing on top-heavy teams with talent deficiencies at the fringes of the lineup; and (c) skaters who drive fantastic individual results and elevate the performance of the teammates around them. The more ‘balanced’ a team is, the harder it will be for a player to be considered a carrier. (For example: think of your favourite Tampa Bay Lightning skater, for a moment, and then remember how many other stars surround him. It’s hard to drive emphatically positive relative results when every line and pairing seems equally capable.)
It’s also worth noting that this group accomplishes these results through different means. In McDavid’s case, it’s because the Oilers are an offensive machine with no parallel or comparison when he is on the ice. In the matter of Kase, it’s because the Ducks are a substantially stronger defensive team with him on the ice. But in aggregate, these players are the ones most outpacing the talent that’s been put around them over the last two seasons.
Now let’s look at the other end of the spectrum. This is the other tail – the players whose results pale in comparison with the rest of the roster and have been drags on performance:
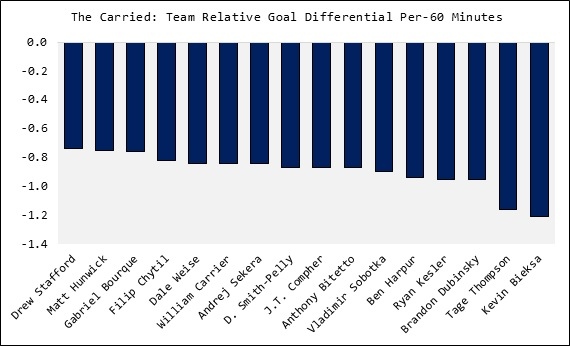
For the ‘carried’ players segment, I think there’s a fascinating question worth asking: Where do you differentiate between players who are abject drags on performance versus players who might be uniquely challenged playing on otherwise stacked teams?
I look at players like Vladimir Sobotka and Ben Harpur as two poor performers on bad teams, which only serves to compound a problem. Whereas a player like William Carrier may interest me if I’m another team in the league – Carrier’s results are bad, but some of this is because he has been buried in a depth role on a Vegas team that’s been as good as anyone in the league at even strength over the last two seasons.
Such a question is more about front office player valuation and finding potential market inefficiencies, and that type of nuance is always worth considering. But at the end of the day, it’s also fair to say that this group of players is at the top of the list when it comes to future displacement. Poor performance is still poor performance, and front offices never sleep when it comes to improving their lineup.