
Sep 24, 2018
Grading the top-six forward groups for all 31 NHL teams
After an off-season of significant change, Travis Yost looks at the top-six mix for all 31 NHL teams and how they grade out against one another.
By Travis Yost

John Tavares in Toronto. Ilya Kovalchuk in Los Angeles. Max Pacioretty and Paul Stastny in Las Vegas.
Every so often we see an off-season where significant names move from one NHL city to another, and this summer certainly fit the bill. That was especially true for impact forwards, with close to a dozen big names changing teams.
With so much roster overhaul, I was curious to see what the top-six mix looked like for all 31 NHL teams and how they grade out against one another.
Assembling a top six was a reasonably simple exercise for most teams – training camps and preseason games are well underway and we have a sense for what coaches are going to do with their lineups. For a couple of teams (namely Carolina and Chicago, who still have question marks on their second line), it was a combination of training camp review and a bit of forecasting.
I wanted to measure each top six against one another by three measures based on prior season performance and known lineup changes. The measures are as follows: (1) the distribution of individual goal-scoring talent returning to a team’s top six; (2) the distribution of on-ice goal percentage returning to a team’s top six; and (3) the distribution of on-ice territorial control by scoring chance data returning to a team’s top six.
Let’s first look at individual goal scoring. The box plot below shows distributions from last season’s performance based on this year’s expected top-six groups. The box plots show both full range of variation (from each team’s worst to best scorer within the top six) and the likely range of variation (your 25th to 75th percentile). It’s a great way to show which teams are scoring through depth, which teams are scoring through one or two elite attacking forwards and which teams simply don’t have a lot of firepower.
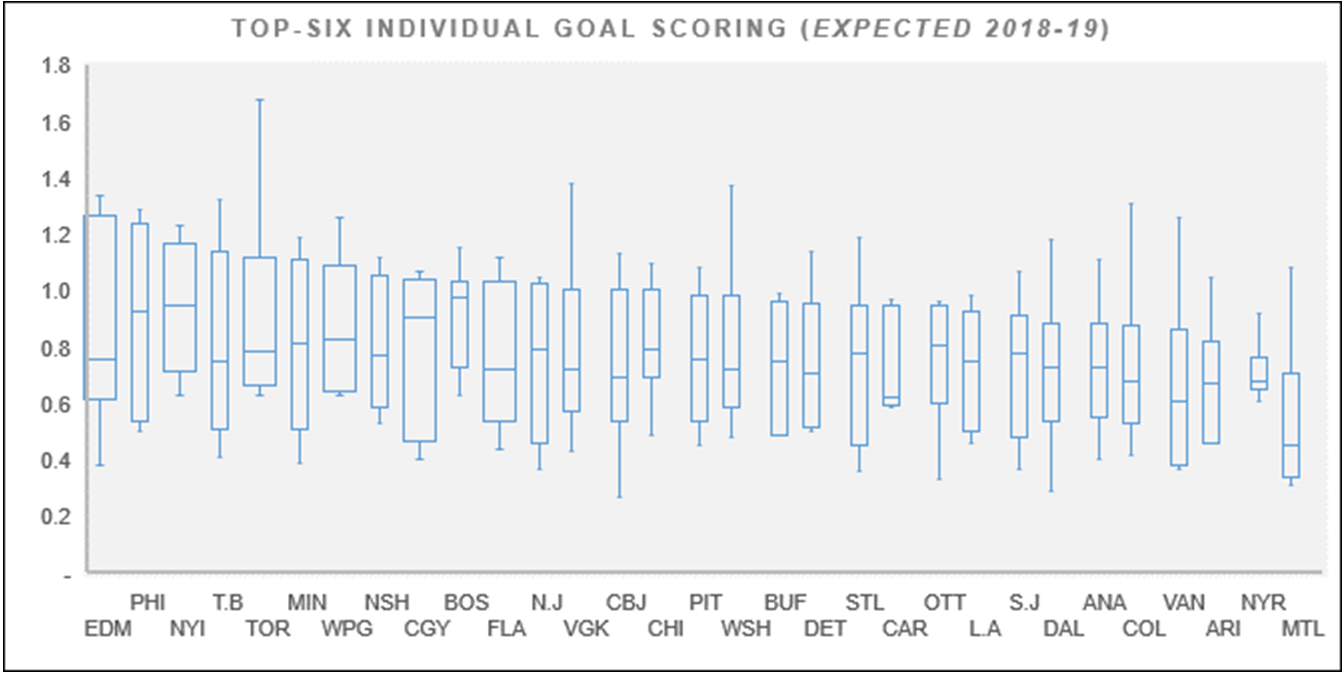
I will admit that when I ran the numbers, I thought about changing the title to ‘The Connor McDavid Graph.’ McDavid is the league’s best scorer by a considerable margin, and that’s particularly true at 5-on-5. But McDavid isn’t just an elite goal scorer. He’s also an all-world setup guy and players like Ryan Nugent-Hopkins and Ty Rattie – what we expect to be Edmonton’s top line on opening night – are going to reap huge benefits from playing on his wing.
The only point of concern for Edmonton is what happens on the second line. You’ll notice the median goal-scoring rates for a top-six forward in Edmonton are lower than most teams in the league and that’s because they generally were ineffective with McDavid off of the ice last year. This will continue to be a story until Leon Draisaitl and company show they can consistently drive a second line to results.
Philadelphia is another notable standout. The Flyers’ offence should be nothing short of ridiculous this season – they are returning three forwards in Claude Giroux, Jakub Voracek and Sean Couturier who all finished in the top 30 in scoring last season. Add another year of playing experience for youngsters Travis Konecny and Nolan Patrick, plus a 36-goal guy in James van Riemsdyk, and you have attacking options flooding the lineup.
One last note: Toronto’s box is much, much longer than any other team in the league. The reason is pretty simple – Auston Matthews was a freight train last year, averaging more goals per-60 minutes (1.7) than any player in the league. For context, the unstoppable William Karlsson was a comparably paltry 1.3. If Matthews can sustain similar production through 2018-19, the Leafs will frequently be running up the score on the opposition. (Similarly, we probably haven’t appropriately captured the type of impact Tavares will have on his wingers.)
That about covers the individual goal scorers. Let’s bring in more on-ice oriented measures. Here, we will look at Goal%, or simply the percentage of goals a team may realize based on their makeup of their top six. This brings in a defensive component that individual goal scoring wouldn’t.
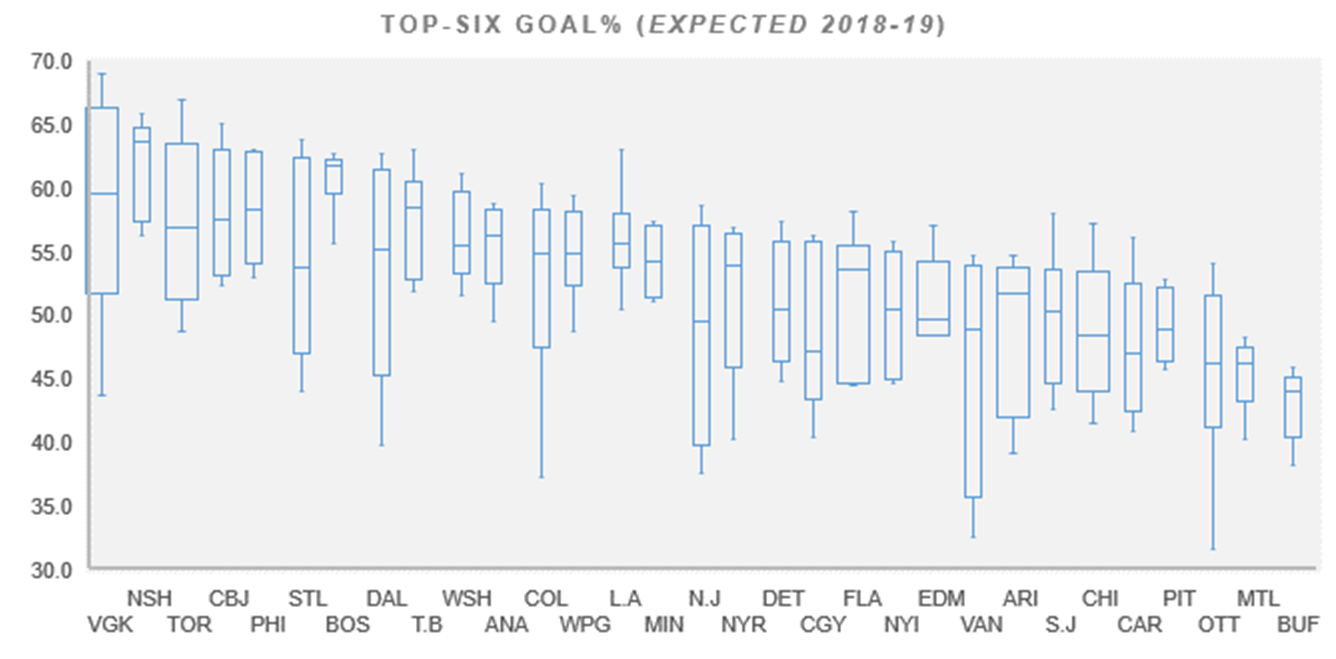
I posed a question over the weekend about Vegas’ top six, namely: How many teams in the league have a better situation? I don’t think we should expect to see Karlsson shoot 20 per cent. I don’t think Marc-Andre Fleury stops 93 per cent of shots over the full season. And I don’t think they are going to be catching any team by surprise this year.
With that said, I still can’t see how the Knights’ top six doesn’t roll over most teams around the league. The Jonathan Marchessault, Karlsson and Reilly Smith line proved indefensible all season long – an utterly ridiculous collection of speed, pace and hockey smarts in all areas of the ice. Preseason results so far have been eerily similar to the 2017-18 season, with the line seemingly scoring at will.
And now the Golden Knights second line has been upgraded – particularly in the offensive zone. David Perron and James Neal are sizable losses, but that’s forgotten pretty quickly when you consider their replacements are Max Pacioretty and Paul Stastny. Pacioretty, prior to last year’s futile season in Montreal, had strung together four consecutive 30-goal seasons and is still 29 years old. With a playmaker like Stastny, you imagine those goal-rates will spike pretty quickly.
Nashville is the second team to note here and I would be remiss to not mention their terrific returning group. The Predators weren’t nearly as active as most of the Western Conference, but they are also bringing back a top six of Ryan Johansen, Filip Forsberg, Viktor Arvidsson, Kyle Turris, Kevin Fiala, and Craig Smith.
There’s plenty of offence within this group, but most of these guys are also sensational defensively, which is one of the biggest reasons the Predators were so difficult to score on last season. Pekka Rinne was a star, but a combination of elite two-way forwards and perhaps the league’s best blueline in front of him had had a huge impact. The Predators had the league’s best 5-on-5 save percentage last year, it should be noted, at 93.6 per cent.
Our last measure looks at dangerous scoring chance generation. I like taking a peak at these because I don’t want to misevaluate groups of players who may have been disproportionately lucky or unlucky last season – the type of luck that can create inaccurate forward-looking forecasts. Plus, knowing how important territorial control is in the modern era, it gives us a great idea of the teams who are better at owning the puck:
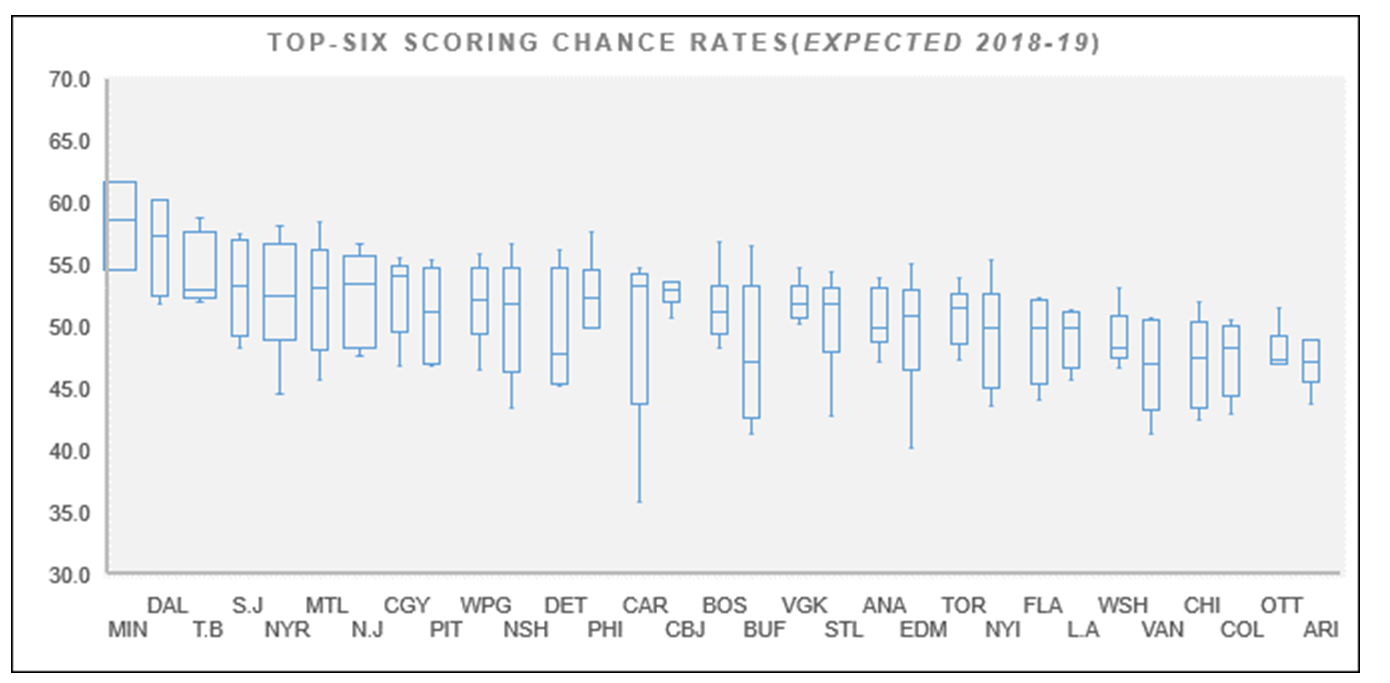
Most teams in the league have a top six that will get the better of possession against their opponents because these groups tend to take the hammer to depth forward groups when they have the opportunity. There aren’t a ton of surprises in the top group (Dallas and Minnesota were extremely top-heavy last year and Tampa Bay is loaded everywhere), but I did do a double-take on Montreal sitting inside of the top five.
This is a good example of when possession doesn’t mirror goal scoring. The Canadiens actually did have a sizable amount of the puck last year, especially with guys like Brendan Gallagher (58 per cent) and Phillip Danault (54 per cent) on the ice.
But the Canadiens just don’t have the same type of individual shooters that most other teams around the league do, nor do they have the playmakers down the middle of the ice to set up opportunities with frequency. Add that to the fact that they will be taking on an even larger role this year against likely tougher competition, and it seems likely that the Canadiens will continue to struggle putting the puck in the back of the net.
Lastly: I’ve mostly covered the teams in the upper echelon of our measures but it’s hard not to look at this and think teams like Ottawa and Arizona are really going to need some of their rookies to step up and play well right out of the gate.
Ottawa is severely undermanned and it’s likely that they could trade one of the two pieces (Mark Stone or Matt Duchene) that is helping them stay out of dead last here. Arizona is in another developmental year, and even if new acquisitions like Michael Grabner and Alex Galchenyuk produce, their ceiling still seems somewhat limited.
Data via Natural Stat Trick.