Mar 17, 2015
How can Habs lift value of Subban, Markov?
Travis Yost looks at how the Montreal Canadiens deploy their top defence pair and with which forward lines they make the greatest difference.
By Travis Yost

In last week’s piece on Tampa Bay’s power play and penalty killing units, I circled in on what I thought was a much larger issue than was probably being received in hockey circles – the Lightning’s inability to generate shots on the power-play, and inability to suppress shots on the penalty kill. The piece really underscored both the strengths and weaknesses of what new-age hockey statistics can provide. In certain circumstances, shot-based analysis can provide better understanding of true performance than goal metric analysis can – this is the reality of the sport of hockey, and the small sample sizes that goal-based analysis usually provides.
Often times, though, the new-age hockey statistics offer little more than a starting point for more complex analysis. While we can reasonably argue that Tampa Bay’s power-play and penalty kill is probably worse than their conversion rates say they are, we can’t really explain in great detail as to why there are myriad problems on both ends. To complement the data, careful video-based analysis can provide greater insight into what’s going wrong, and offer potential solutions.
From a coaching standpoint, there’s real value in being heavily invested on both fronts, particularly as it pertains to lineup optimization. There is incredible value in figuring out what linemates work well together, what defence pairs work well together, and what linemates/pairs work well together. The problem that the head coaching position offers is that you often aren’t given enough time – especially if you’re the coach of a team that grades low on the talent threshold -- to wait thousands and thousands of minutes for the even-strength goals to pile up. It’s one valid reason to dive into shot-based analysis early – to double-check if your lineup decisions are working properly, or to troubleshoot things that may not be what they appear.
There’s one really intriguing example of this provided by the Montreal Canadiens, who have been something of a hockey analytics capital for the last year and a half. Despite the team’s great success in the standings, fans have grown reasonably frustrated on the team’s reliance (and perhaps overreliance) on superstar goaltender Carey Price. To my eye, the even-strength problems in Montreal aren’t tied up in talent – rather, there seems to be systemic issues that seem to act as a drag on the team’s overall ability to control play at 5-on-5.
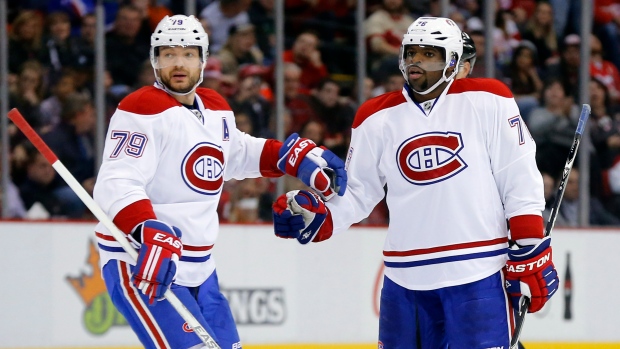
Far and away, the biggest asset among skaters that the Canadiens have is defenseman P.K. Subban, who is a possession and goal-driver no matter where he plays. Montreal gives him as many minutes as humanly possible, not dissimilar to what we see from other Norris Trophy-type talents. Interestingly, he (and frequent partner Andrei Markov) sees his minutes spread reasonably across the top-nine – he’s logged a few hundred minutes each with Tomas Plekanec, David Desharnais, and the Lars Eller lines.
I say ‘interestingly’ because there seems to be a data point in the marriage of the Subban/Markov pairing with Montreal’s top-three lines. Using tools at War on Ice and HockeyAnalysis, I was able to pull out Corsi% data for Montreal’s top defence pair with each of the above-referenced centres. I also pulled out ZoneStart% data for a quick idea on how the groups were deployed. How do the groupings look?

I think you can certainly make the argument that the Desharnais line is a fair bit reliant on the Subban/Markov pairing to prop them up – when they play with a non-Subban/Markov pair, their Corsi% drops six percentage points. A reasonably similar argument can be made for the Plekanec group – when they are with a non-Subban/Markov pairing, their Corsi% drops about 4.0% percentage points.
What’s interesting is the Eller group. The Corsi% with and without the Subban/Markov pairing is virtually identical. The Eller line has been primarily used as a shutdown trio of sorts, taking a swath of the tough defensive zone starts all season long. With the Subban/Markov pairing, they’re starting an unfavourable number of shifts in the defensive zone. Without the Subban/Markov pairing, they’re starting an even less favourable number of shifts in the defensive zone.
You’ll note that, regardless of whether or not the Subban/Markov pairing is on the ice, Lars Eller’s Corsi% basically holds at 48%. Why does the Subban/Markov pairing not have the considerable effect it has on the other two lines here?
Thinking out loud, there are a few possible answers to this question. One, it’s plausible that the Subban/Markov pairing have more of a team-relative effect when starting in the offensive zone. Two, it’s possible that the Desharnais and/or Plekanec group are more reliant on their puck-moving ability from the back-end. Three, it’s possible that the Desharnais and/or Plekanec group do more with what Subban/Markov bring to the table than the Eller group can.
That’s the sort of question you can answer more definitively by marrying the data with video-based analysis. But, if I’m Michel Therrien, I’m certainly considering the above graph when deploying my lines going forward.
For some reason or combination of reasons, the Subban/Markov pairing has a more palpable effect on the Desharnais and Plekanec lines – less so the Eller line. Deploy accordingly!


