


Jun 11, 2018
The numbers say stick with the 3M Line
Calgary’s Matthew Tkachuk, Michael Frolik and Mikael Backlund were particularly snake bit last season, Travis Yost writes.
By Travis Yost

One of the biggest challenges for general managers in the off-season is where to upgrade the roster.
Every team wants more talented players in their lineup. The trick is being able to isolate which areas of the roster are in real need of improvement. Since the NHL is a league with a hard salary cap and fixed number of roster spots, every decision has an opportunity cost. Misidentify the real problems with your team and you may take another step backwards.
The Calgary Flames are perhaps the most interesting case study here. Their playoff aspirations soured in the middle of the season and they finished the year with a disappointing 84 points – good enough for fifth in the Pacific Division. Their undoing, by and large, was driven by goal-scoring challenges. They finished the year averaging just 2.6 goals per game (27th in the NHL) with a power play that converted just 16 per cent of the time (28th in the NHL). Fix that and you probably have a playoff team.
Not being able to turn quality zone time and scoring chances into goals is probably the easiest way to post-mortem Calgary’s season. There’s no doubt that the Flames were effective at driving play into the attacking third – they just had a whale of a time beating opposition goaltenders. And while that’s generally true for most of the team, one group in particular – the vaunted “3M Line” of Matthew Tkachuk, Michael Frolik and Mikael Backlund – was particularly snake bit.
To illustrate, consider each Calgary skater’s on-ice performance versus break-even. An average skater would see about 50 per cent of the shots, scoring chances, or goals in favour of Calgary when he was on the ice. An average skater would also see a 92.3 per cent save percentage behind him, while finishing on 7.7 per cent of all shots. The further you get away from these measures, the harder it’s going to be to win games.
Take a look at each skater last season:
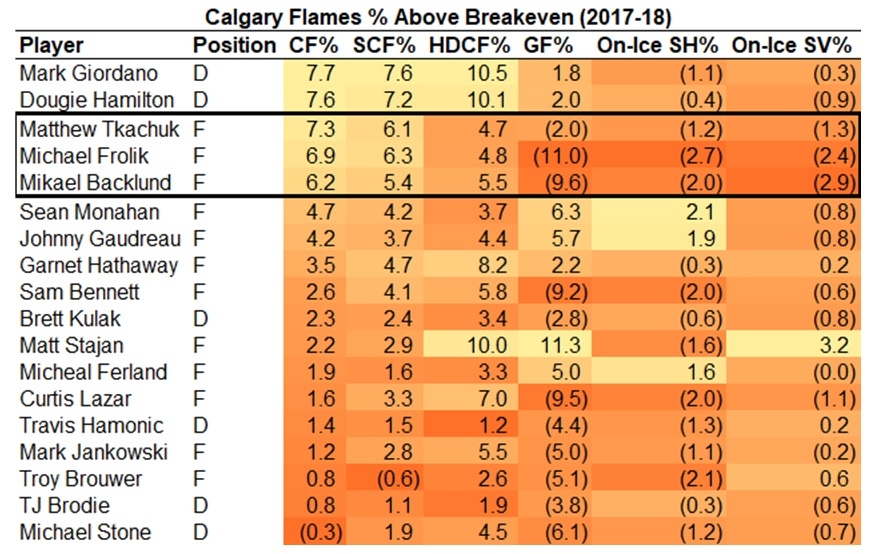
You can see that just about every Flames skater outshot and outchanced the opposition over the full season, but the goals didn’t fall as kindly. The 3M Line in particular was that to an extreme.
Over the course of the season, they ran roughly a 57 per cent Corsi%, 56 per cent scoring chance rate, and 55 per cent dangerous shot attempt rate, all per Natural Stat Trick. So whichever your preferred non-goal measure of performance, it’s clear they threatened more often than not.
But their goal rates were abysmal – around 42 per cent for the full year. That’s in large part because their “percentages” – the percentage of shots they scored on and the percentage of shots against that ended up being goals – were way askew from league norm. The group experienced a save percentage barely over 90 per cent, and scored on about 5.6 per cent of their shots. That’s crippling.
The thing about the percentages is they tend to be highly volatile and not particularly indicative of any individual player’s talent. It’s something that has been measured exhaustively, but you don’t need to take my word for it. We can simply look at each of these players historically and see exactly how “out of the norm” last year was.
Here’s on-ice shooting percentage:
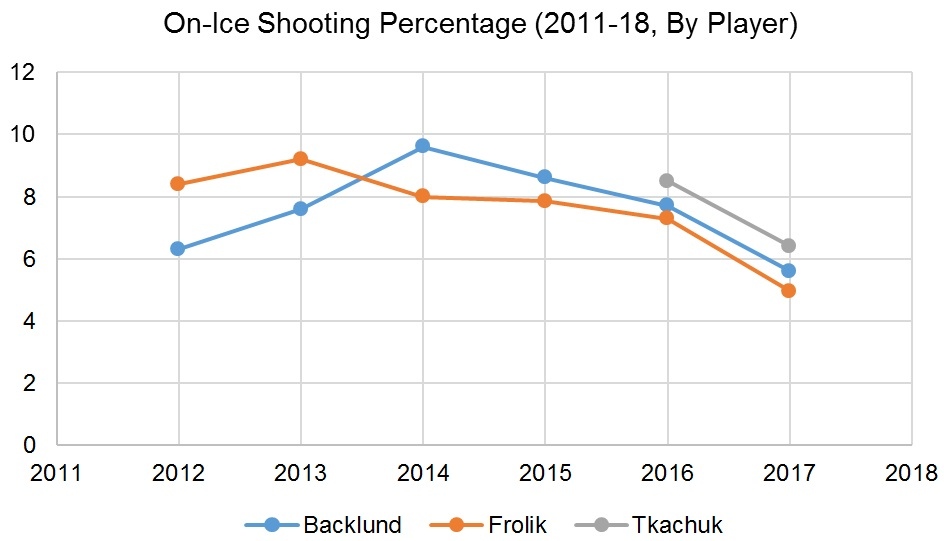
For Backlund and Frolik, those are the worst numbers we have seen in years. Think about how mathematically challenging this is, too. One unit scores on 5.0 per cent of their shots, whereas league average is around 7.7 per cent. To score the same number of goals at that conversion rate, this line would need to generate about 40 per cent more shots than your average line around the league. That, of course, is easier said than done. (It’s probably close to impossible.)
Tkachuk notably slid considerably from his rookie to sophomore season. A lot of this is collinear with the struggles of Backlund and Frolik, but it’s still a pretty massive downswing.
But shooting percentage is only one side of the equation. If you’re getting goaltending, even in spurts, you may still put together a nice season. Except that cratered too, just as badly:
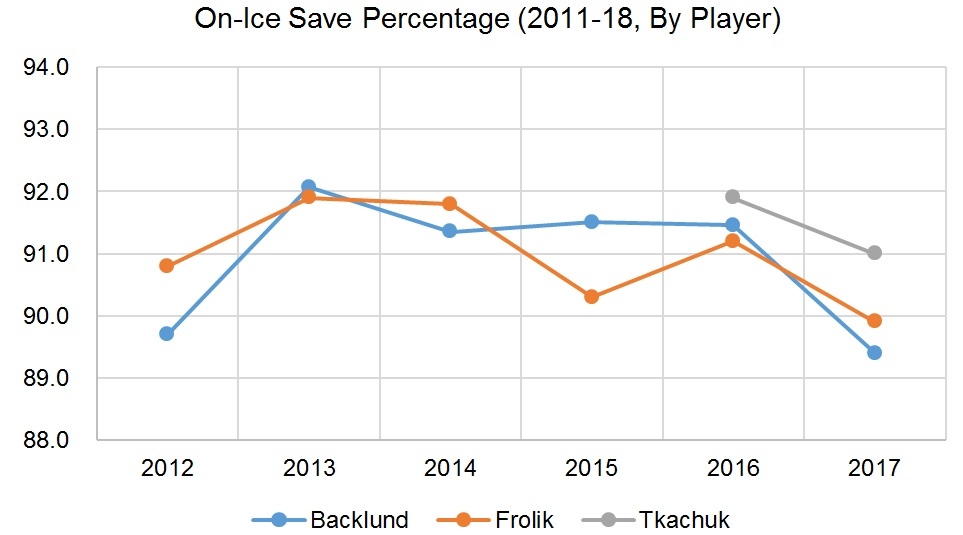
Other than Backlund having a horrible 2012-13 season, steady state for all three of these players looks like a save percentage somewhere around league average. Except in 2017-18, save percentage numbers sat near (or in Frolik and Backlund’s case, below) 90 per cent. Again, think about this in context: If this trio wanted to prevent the same number of goals as another unit in the league with a 90 save percentage, they would have had to slice off about 23 per cent of the shots they faced. Good luck with that!
Bringing this back to the original question: There will be an abundance of questions for Brad Treliving and company to answer, and they will take a few swings this July to try and upgrade the roster.
Perhaps the best move they can make, though, would be to avoid touching their second line. They had a tough season, no question. But the supporting data suggests they were far better than what meets the eye. If resources are available to the team, they probably expend them elsewhere.