
Oct 25, 2016
What’s driving the early increase in scoring?
The numbers show teams are generating more shots from dangerous scoring areas on a per-game basis, Travis Yost writes
By Travis Yost

Nearly two weeks of the NHL regular season has elapsed, and by far the most curious development is the increase in scoring across the league.
Like most fans, I tend to think that the league – from a sheer entertainment perspective – could benefit from an increase in scoring rates. And with most teams having at least five games or so in the bag, that’s precisely what we’ve seen.
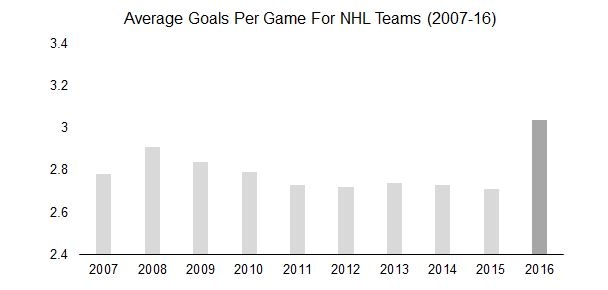
The average NHL team this year is scoring a shade over 3.0 goals per game. The average NHL team prior to this year scored about 2.7 goals per game. Net 0.3 goals per game for a team doesn’t seem like an awful lot at first blush, but that’s a pretty big difference – more than two standard deviations from historical averages.
What’s to credit (or blame) for the increased scoring? The first, and perhaps most logical answer is sheer randomness. It’s possible that we just enjoyed a brief peak in scoring that will regress in future periods. That’s a reasonable bet, considering we have 10 similar predating seasons that ended up with nearly identical goal-scoring rates.
The second answer is that goaltending competency has dropped. I don’t necessarily buy this for one reason: The vast majority of goaltenders playing right now also played in prior periods, including last season. It’s hard to believe that their competency as a collective just fell off of a cliff, which means that their group save percentage – their stop rate is around 90.3 per cent, a number we haven’t seen since 2005 – is being driven by other variables.
The third answer? Attacks are becoming more pronounced, be it on a quantity or quality level.
The good news is that this is a pretty easy thing to fact check. We can pull scoring chance estimates at the team level from Corsica. If our theory is correct, we should see an increase in (a) the rate of scoring chances; and/or (b) the percentage of total shots that we would consider dangerous chances. If our theory is incorrect, then it becomes much more likely that randomness is the driver of the scoring increase – and that what we are seeing right now is nothing more than an aberration.
Here’s what the data over the last 10 years looks like:
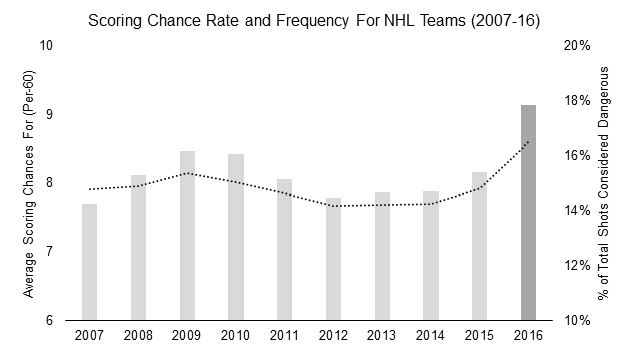
So, if you’re a fan of offence and think the games are more entertaining when teams are trading chances, then you would probably be pleased to know that it’s not just noise – teams are generating more shots from dangerous scoring areas on a per-game basis, and a higher percentage of teams’ overall shots are also coming from more dangerous scoring areas.
How does this evolution occur? Our own Bob McKenzie pulled together some interesting quotes on the development from coaches and executives around the league, and the prevailing theory is that an increment in skill and speed across the league has driven a good piece of the change. More competent attackers across the board – and the phasing out of pure specialists/enforcer types in the depth of lineups – could certainly be a factor.
This, to me, is an encouraging data point. While I don’t think it’s the sole explanatory factor behind the increase in scoring, I think it does well to explain a piece of why league shooting percentages are up (and, conversely, why league save percentages are down). Intuitively, we should see a material change on these fronts if there has been a lgeitimate behaviour change in where shots are being generated from. And right now, we can reasonably conclude that teams are taking more dangerous shots than they have over the last decade.
It’ll be fascinating to see if this behaviour continues over the course of the year. I’m inclined to think we’ll see a regression towards prior seasons, but I think there’s a fair chance we still one of the higher goal-scoring seasons in modern record. And I’m not complaining.