
Mar 18, 2019
Who is playing well heading into the final weeks of the regular season?
With the NHL trade deadline in the rear-view mirror, Travis Yost looks at the performance of 19 NHL postseason contenders heading into the final weeks of the regular season.
By Travis Yost

Now that we’re about 10 games removed from the NHL trade deadline, we are getting a feel for how teams are playing heading into the final weeks of the regular season.
How a team is playing this late in the year is obviously critical. Most of the Stanley Cup contenders made moves at the deadline to improve their team performance, and we already know that analyzing more recent play is valuable in understanding the likelihood of future playoff success. (I attribute a lot of this to roster changes, injuries, general changes in individual/team level performance, and so on.)
We will run through all of the numbers in this space in the annual playoff preview on a rolling 25-game basis, but consider this a checkpoint of sorts for that type of analysis. The general caveats apply: in smaller samples of games, teams have disparate strength of schedules and may be uniquely impacted by shorter-term injuries and the like. I have isolated to the 19 teams that are fighting for 16 spots.
Let’s start by just isolating for even strength play first. Here, you have each team’s performance by three measures – the percentage of goals in their favour (x axis), the percentage of shots in their favour (y axis), and the points they have accumulated per-game (size of the bubble).
The best ways to think about performance here in our four quadrants analysis:
- Upper right quadrant: playing exceptionally well
- Lower right quadrant: playing relatively poorly, but having some puck luck (great conversion rates on shots and/or great stop rates)
- Lower left quadrant: playing poorly
- Upper left quadrant: playing well, but low on puck luck (poor conversion rates on shots and/or poor stop rates)
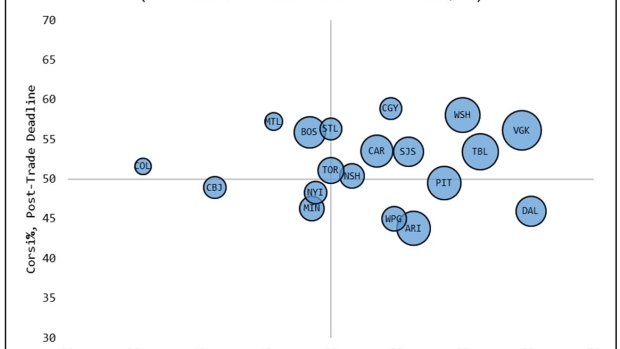
A few of the Canadian teams stand out here for some obvious reasons.
Montreal, as one example, picked a bad time to see their save percentages crater. Canadiens goaltenders are stopping just 88.7 per cent of shots, which is second worst in the league since the trade deadline (Kings are at 88.4 per cent). There is still reason to be bullish with this team on a performance basis at 5-on-5 because of how dominant they are territorially, but the unfortunate reality is that they’re losing ground in the wild-card race in a hurry from this stretch. (We’ll talk about the Montreal power play further down.)
Toronto is also noteworthy because for all of the guffawing about how bad this team is playing right now, everything is graded on a relative basis.
Let’s be clear: there should be little pride in comeback wins against the Flyers, let alone getting throttled by the 31st-place Ottawa Senators. But even their roughest stretch of hockey sees them breaking even in shots and goals at 5-on-5, and it sounds like, absent Jake Gardiner, they’re going to get some injury relief here in short order. So no, Toronto isn’t playing well relative to most contenders. They are playing well enough to sustain the conversation about chasing the two seed in the Atlantic Division, though even that appears fleeting.
Lastly, there’s Calgary. The Flames have been terrifying all season long and have routinely skated most teams out of the rink, be it at the Scotiabank Saddledome or elsewhere. We can still use this as a weekly reminder about how critical it is for the Flames to win the Pacific.
There are only a couple of other teams who appear comparably dominant in the most critical game state, and one just so happens to be that gigantic bubble over to the right in the form of the Vegas Golden Knights. Since the trade deadline, the Knights have doubled up their opponents in goals, are more than 100 shots in the black over a span of eight games, and have just one loss on the ledger. That loss came against Calgary on a back-to-back with a backup goaltender. So, yeah. Win the Pacific, Calgary!
Now, let’s run through the same performance measures but including all situations data. This will be a bit choppier due to disparities in special-teams opportunities but it does well descriptively to explain why teams are moving up and down in the standings.
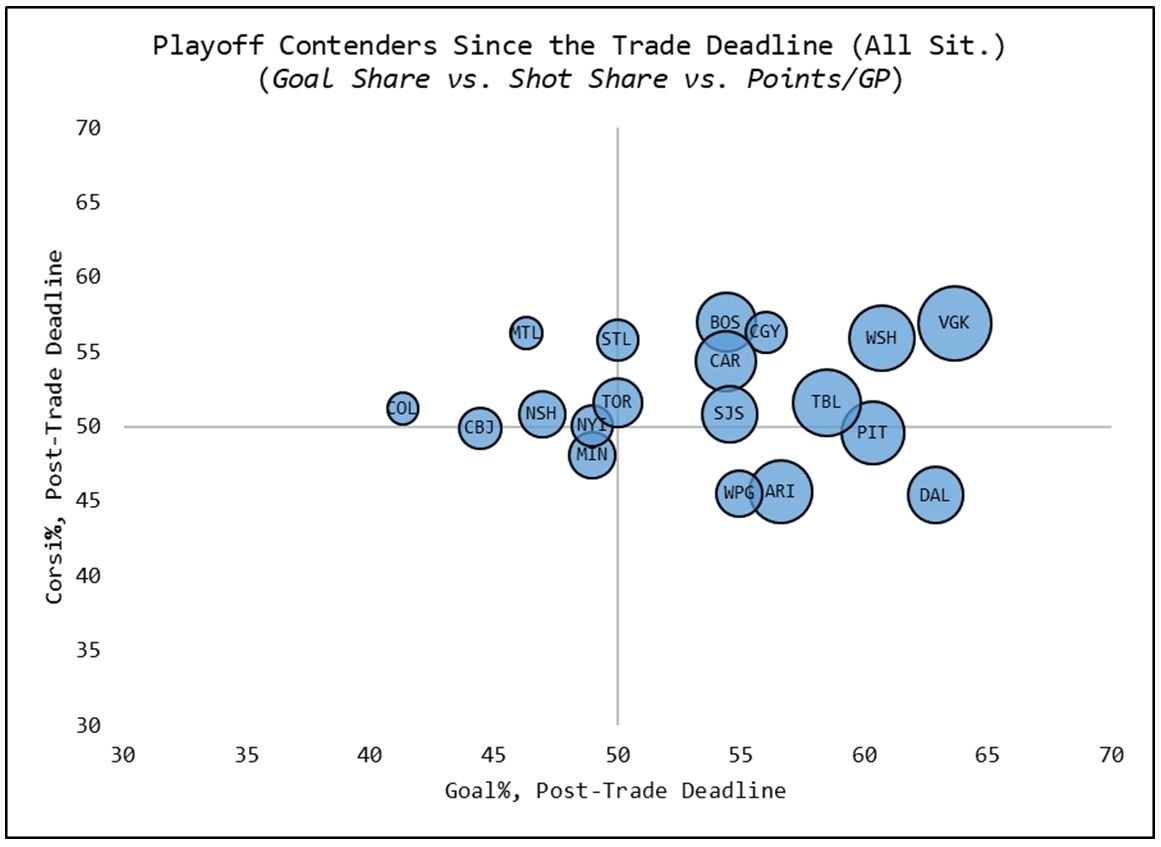
All situations data is much friendlier to the likes of the Boston Bruins and Colorado Avalanche, particularly on the goal fronts. That’s because the Bruins (12.0 goals per 60 minutes) and Avalanche (8.7 goals per 60 minutes) are realizing power play success with high degrees of frequency, which is really just a continuation of how the regular season has trended for both teams on this front. (Nashville sees the biggest decline, as they are -4 in goal differential away from 5-on-5 since the trade deadline.)
I mentioned Montreal’s power play earlier. Their position on the graph really didn’t change, but I would be remiss to point out that there is an underlying theme here about the Canadiens and their power play. Montreal’s reality is that their power play, by and large, will be the reason they miss the postseason if it comes to that.
Since the deadline Montreal has one power-play goal in nearly 50 minutes of hockey, which is 30th in the NHL over that span. It’s something this team has dealt with all season long, and it’s rearing its ugly head at the most critical point of the regular season.
An average power play this season is scoring a little over seven goals per 60 minutes of hockey, or converting on about 20 per cent of their power-play opportunities. Montreal season-to-date: 4.2 goals per 60 minutes of hockey and converting on fewer than 12 per cent of their power play opportunities. Just maintaining an average man advantage in Montreal would have seen them gain 18 goals in the standings, which is worth approximately three wins.
How critical is three wins? On Sunday, the Canadiens were four and three points back of the two wild-card slots, respectively. I’ll let you do the rest of the math.