A month into the NHL regular season, front offices are starting to get a feel for the quality and true talent level of the lineups they have assembled. As more games are played, confidence – in either direction – is strengthened.
But the NHL moves lightning-quick, and front offices (and coaching staffs, for that matter) must make decisions with the limited data or video available to them.
Consider the situations in markets like Ottawa (4-8-0), St. Louis (3-8-0) and Columbus (3-9-0) – three teams with varying expectations, but three markets where seats are getting hot. Expectations are real, and so too is the pressure to deliver. Do the front offices sit idly by and hope the roster they put together can pull itself out of a rut, or do they make early-season changes in the hopes of steadying the ship?
One of the most important data points to consider at this point in the season in relation to a team’s win-loss record – which can lie to you in both directions this early – is in the goaltending arena. The position is already volatile, and over a 12-game sample, performance can be as random as flipping a coin.
Overperformance or underperformance over a month-long stretch can drastically alter our understanding of a team’s true talent level long term – goaltenders who are running hot may be glossing over mediocre results the same way goaltenders who are running cold may be hurting otherwise productive teams.
At this point in the season, I like to see how much of a directional impact goaltending is having on the 32 teams. First, let’s look at the goaltending landscape this season. The below table gives us goal scoring frequencies against for each team, as well as how they are deploying their goaltenders from a usage standpoint. Most teams have dressed just two goaltenders, with five teams (Columbus, Chicago, Ottawa, Seattle, and Toronto) using three; Chicago is the only team so far to use more than three.
(Note: Shootout goals against are excluded from the table below.)
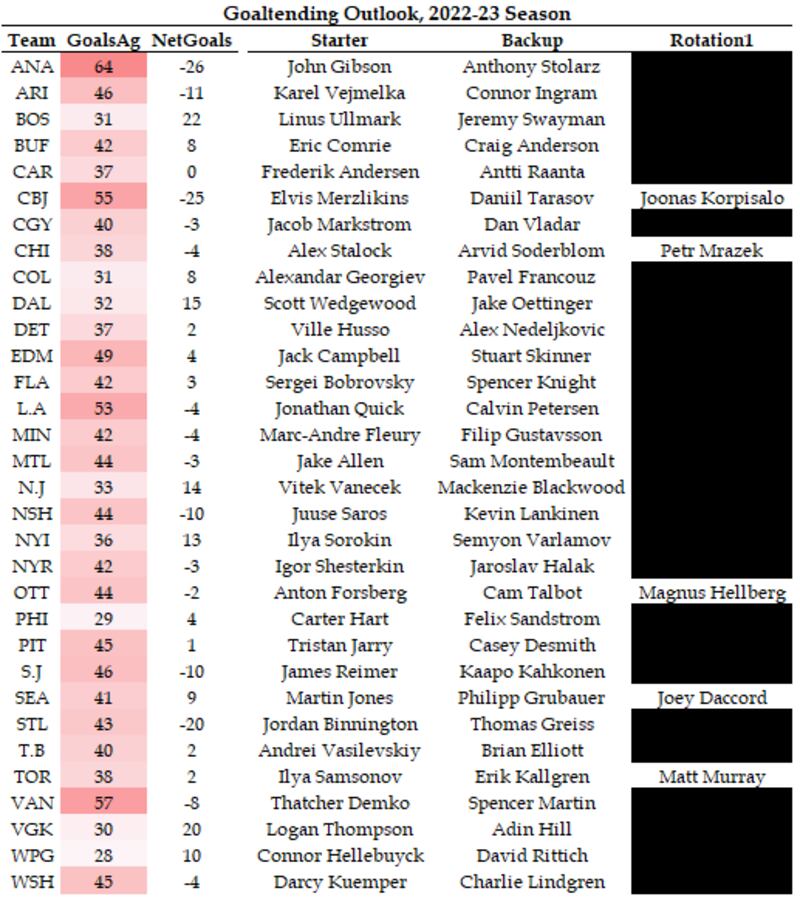
Teams like the Anaheim Ducks (64 goals against) and Vancouver Canucks (57 goals against) have been extraordinarily generous defensively, whereas the Philadelphia Flyers (29 goals against) and Winnipeg Jets (28 goals against) have been much more difficult to crack. But the goals against numbers measure the entirety of the defensive performance, inclusive of goaltending. What we need to do is to understand how much goaltenders specifically are contributing to that number; sometimes, great goaltenders are killed by poor defences in front, the same way great defences can be burned by bad goaltending.
If we look at expected goals against based on both the shot volume each goaltender has faced, as well as the probability of each of those shots finding the back of the net, we can better understand how goaltenders are impacting their team’s position in the standings.
Which teams are getting boosts from their goalies, and which teams are being sunk from poor play in the net?
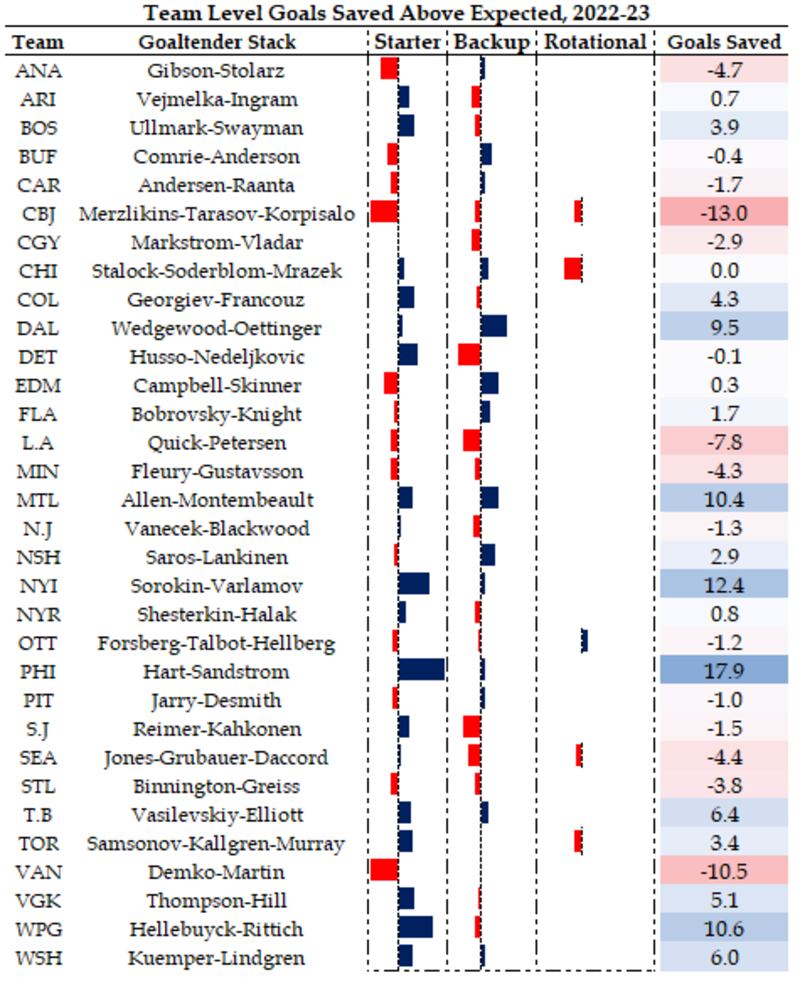
The right column shows how many goals have been erased (or added) to the goals against column after we isolate for goaltending performance. You can see that in some cities, there are dramatic changes.
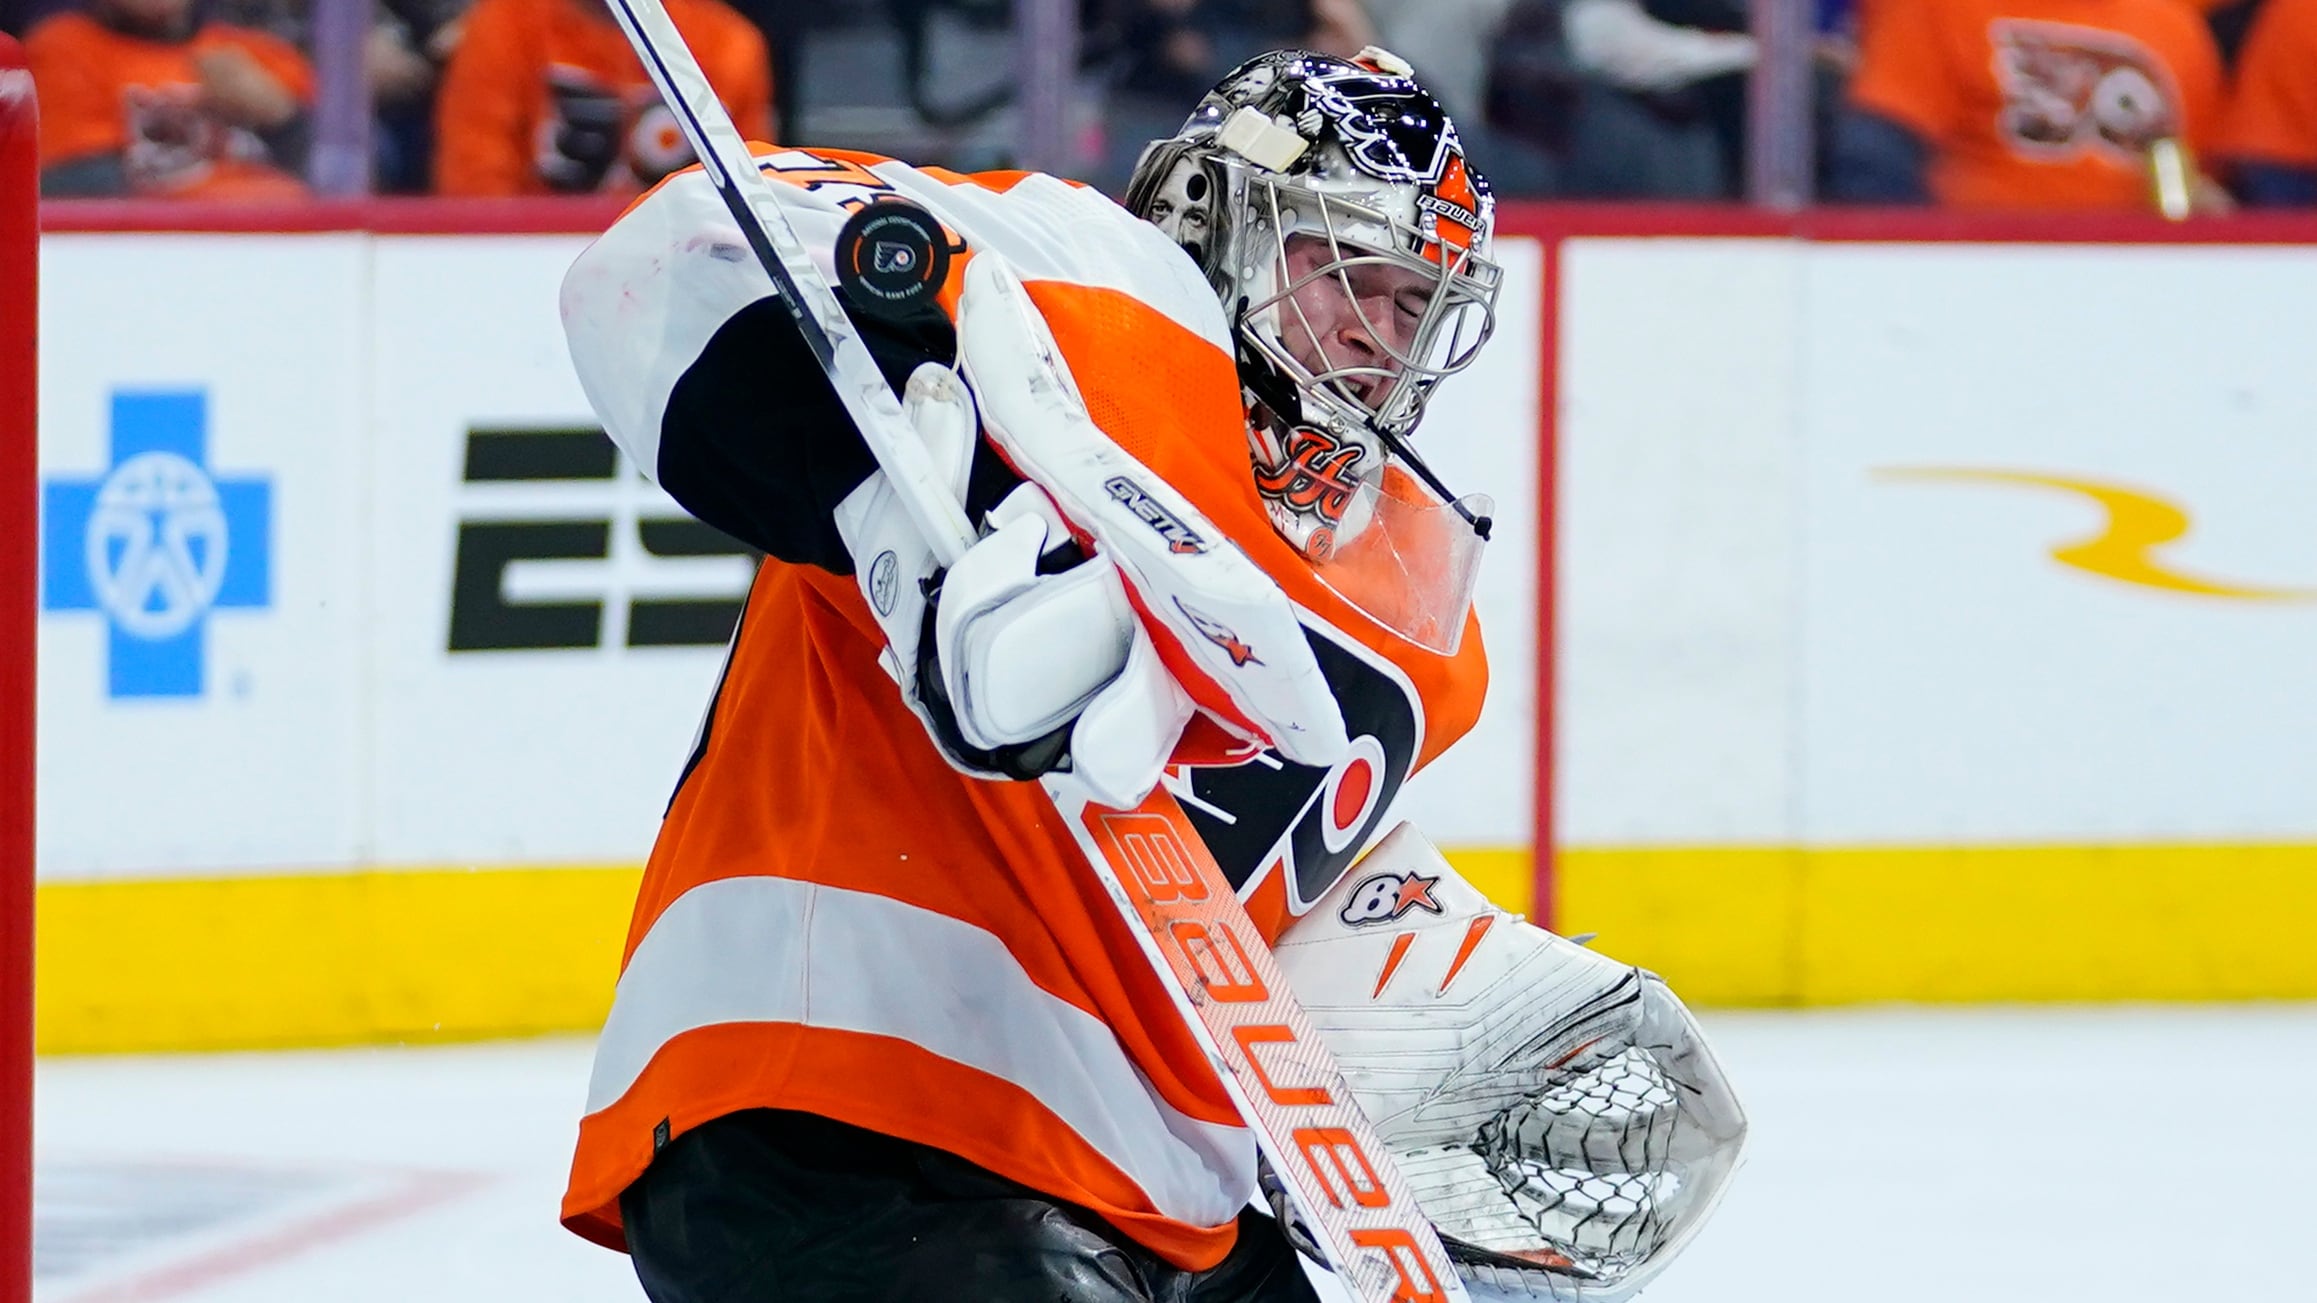
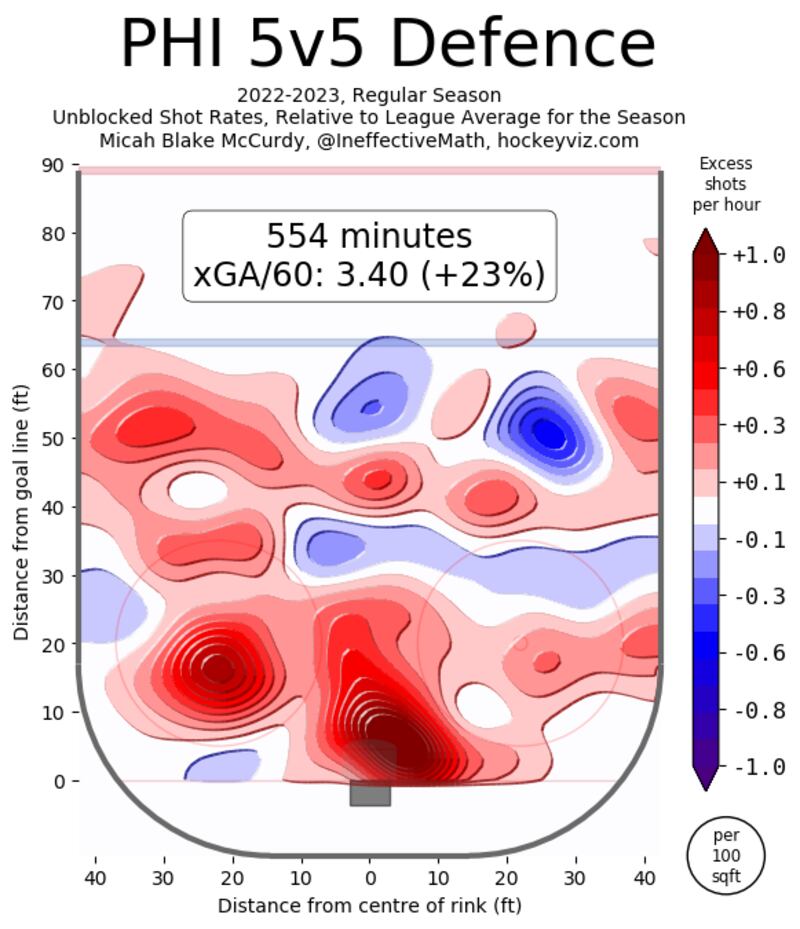
On the upside, the Flyers (+18 goals saved), New York Islanders (+12 goals saved), and Jets (+11 goals saved) have received incredible early-season goaltending performances from their group, buoying them in the standings. The Flyers, in particular, are fascinating – Carter Hart is a bona fide early-season Vezina Trophy candidate, and HockeyViz’s capture of what’s going on in the Philadelphia defensive zone is his strongest argument:
On the other end of the spectrum, you have teams like the Columbus Blue Jackets and Canucks who have had porous goaltending to open the year. In Vancouver, you have a goalie in Thatcher Demko who has a sterling track record up until this season – in other words, the type of player you expect to pull himself out of a rut, and quickly.
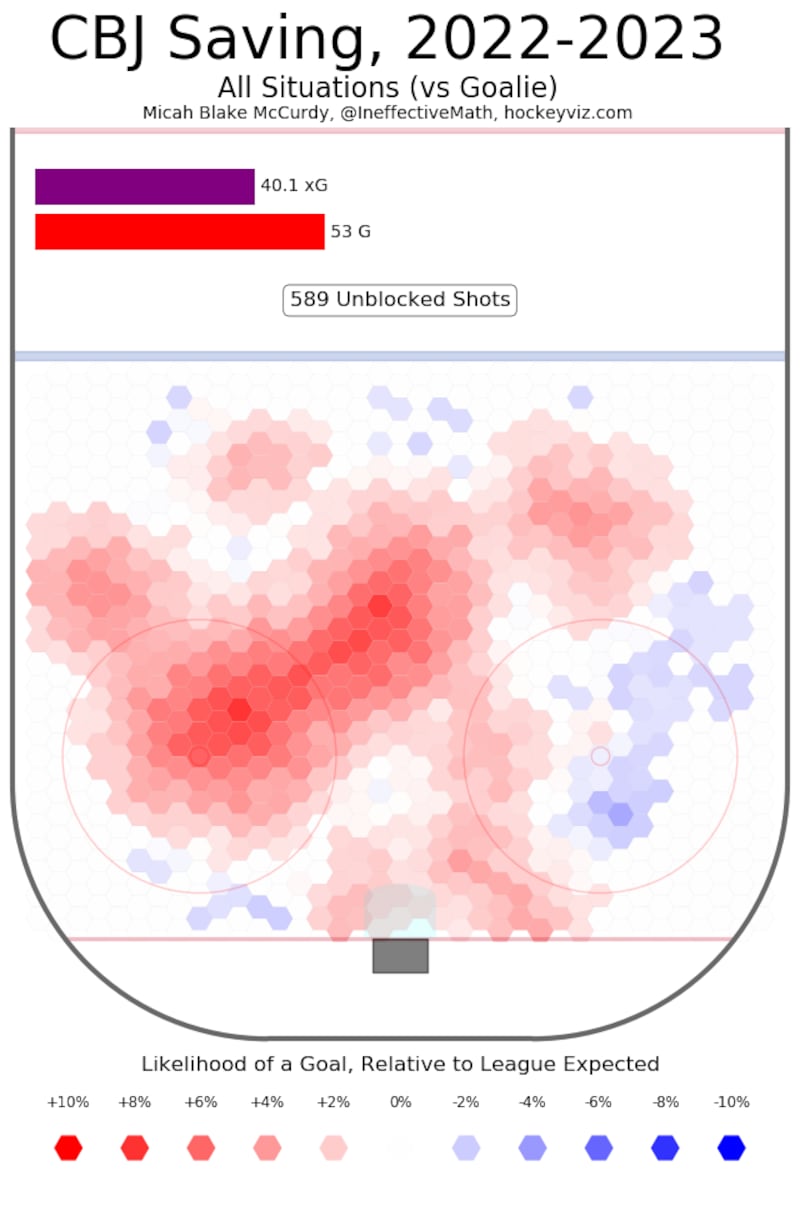
That’s different than a team like Columbus, who is 13 goals worse than expected, dead last in the NHL. Elvis Merzlikins and Joonas Korpisalo have struggled in years past, and are giving up goals from every area of the defensive zone at higher rates than their league average counterparts (via HockeyViz):
There are never easy answers when it comes to goaltending, but for front offices trying to gauge just how capable their lineups are relative to the rest of the league, it’s imperative to understand their contributions to the standings.
A misread as to how much – or, how little – a goaltender is impacting a team’s performance can lend itself to panicked roster moves or overconfidence, neither of which ends well in the long run.
Data via Natural Stat Trick, NHL.com, Evolving Hockey, Hockey Reference