
Oct 24, 2017
A cautionary tale about shooting performance
Travis Yost attempts to calm the nerves of fans in Montreal and Edmonton with a look at how hot and cold team shooting percentages over small samples tend to move back towards normalcy.
By Travis Yost

One particularly frustrating element of the NHL’s low-scoring era is that teams will frequently go through random stretches during the regular season where they simply can’t buy a goal.
Skill can be a pretty strong equalizer, though. Teams loaded with individual shooting talent generally won’t stay down for too long. Teams who are starving for offence, with only a handful of guys who can create scoring chances on their own? Yeah, their streaks can be longer and more painful.
Shooting talent seems to be the topic du jour right now, especially in light of a series of teams with high expectations seeing their results wildly askew. Montreal and Edmonton are shooting under 4 per cent at 5-on-5 to start the year, which is astronomically low. You might rate Edmonton’s offence better than Montreal’s (I think everyone would), but neither of these teams is a 4 per cent shooting talent team.
Then you have the other end of the spectrum. New Jersey and Vegas had very little, if any, offensive expectations this year. Ottawa opened the season without their lone superstar. All three of these teams are shooting 10 per cent or higher at 5-on-5.
The cautionary tale about shooting performance is that it heavily regresses towards league averages. Time and time again we see teams get off to slow or hot starts, only to see those numbers move back towards normalcy. We have studied this over and over again, and the findings remain the same.
I think most people understand the concept of regression (few people genuinely believe a team’s true shooting talent will stay at 4 per cent or 10 per cent for an entire season), but aren’t necessarily sure what it means for their team and why most hockey statisticians remain focused on other measures, like how well a team is generating shots or how frequently a team is getting into dangerous scoring areas.
To that end, maybe the best way to calm the nerves of fans in Montreal and Edmonton (and to caution the fans in New Jersey, Ottawa, and Vegas) is to show specific teams who have been similarly situated.
Let’s start with teams who shot incredibly poorly out of the gate. How did their numbers evolve with time? Did the concept of “regression” work in favour of those teams? Here are the 10 worst (by the 10-game mark) and their shooting percentage trended over time:
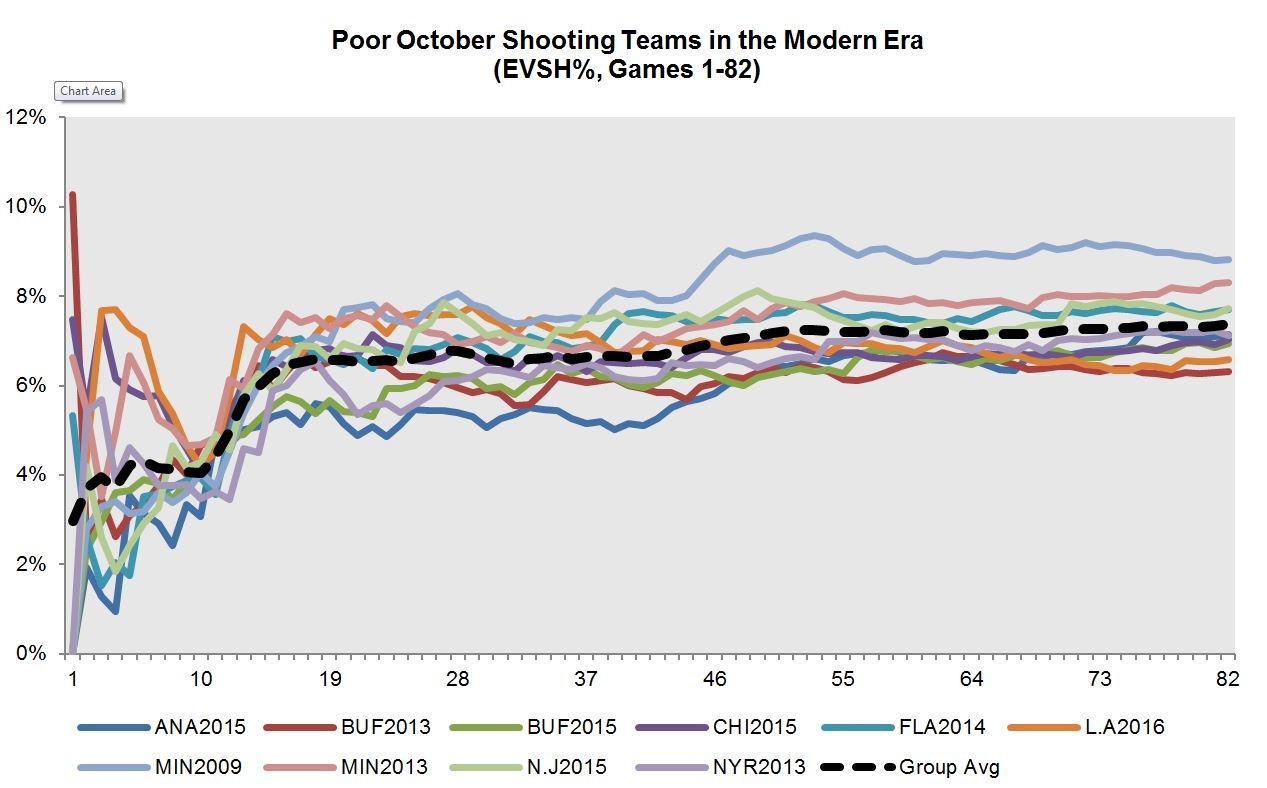
After 10 games, these teams were sitting around 4 per cent shooting. At the end of the season, the group on average shot 7.4 per cent – just a tick under the league average, and that despite a ridiculously unlucky start to the season. Some of these teams – like Minnesota in 2009 and 2013, and New Jersey in 2015 – ended up shooting above league average for the entire year. And the worst finish of a team here, the 2013 Buffalo Sabres, still ended up shooting 6.3 per cent as a group. That’s a brutal finish, but still multiple percentage points above where they sat in October.
So, in practice, we know that teams who couldn’t buy a goal to start the year ended up shooting at roughly the same conversion rate as any other team in the league. Is the reverse also true – Do white-hot teams see their shooting percentages move south as games elapsed?
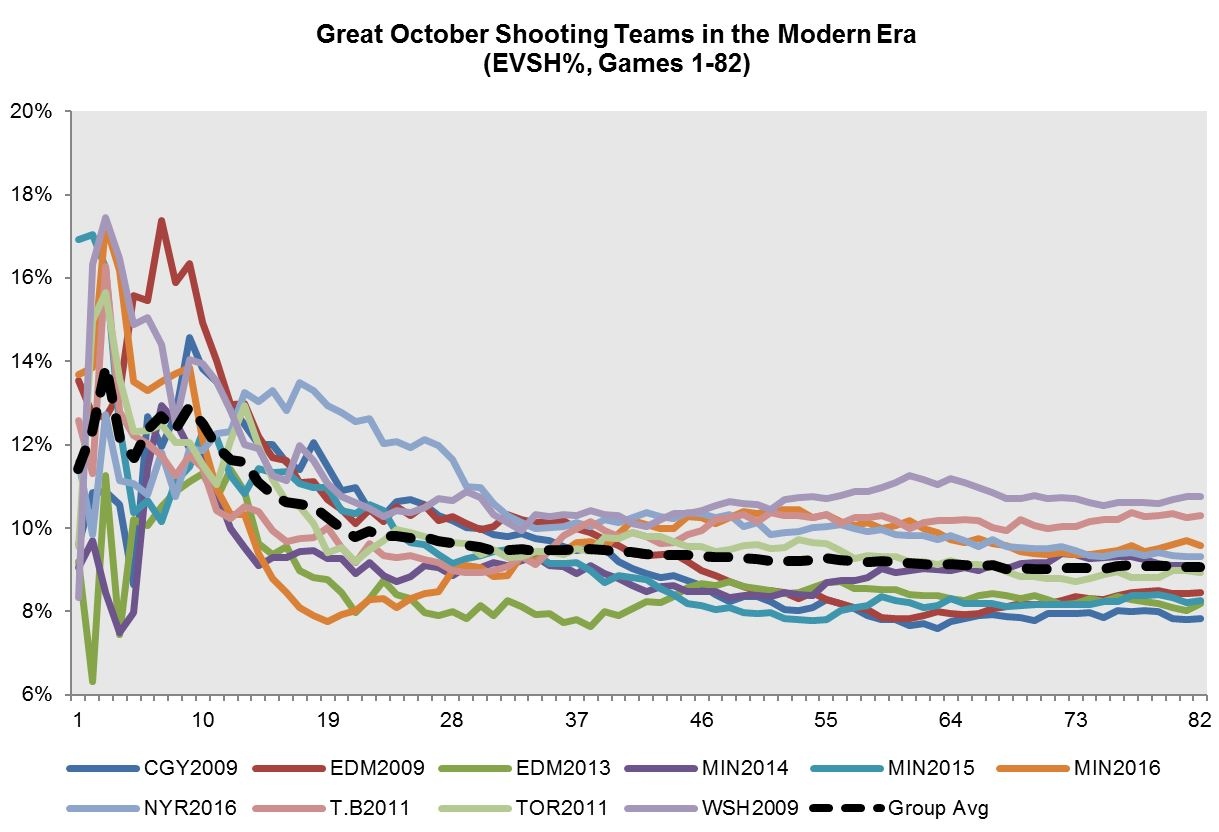
These teams were shooting lights out to start the year, basically scoring a goal on every nine shots. Barring complete chaos and breakdown in other game states, it’s pretty hard to lose when you’re finding the net with that sort of frequency. But notice how the opposite trend is observed here. The teams opened up the season shooting about 12 per cent, and ended up shooting around 9 per cent by year end. That’s a three-percentage-point drop – nearly identical to the rebound poor shooting teams saw in their trended performance.
Tampa Bay in 2011 and Washington in 2009 still ended up shooting over 10 per cent on the year, which makes sense. If any team would be less susceptible to complete regression, it’s a team with guys like Steven Stamkos and Alex Ovechkin. And yet both of these teams still saw a two-percentage-point drop from where they started the year. On the other side of the ledger, there were plenty of teams – look at 2009 Calgary – who ended up shooting at league average rates by year end.
The point isn’t to reemphasize that regression is a real thing in professional sports and hockey – by now, most people understand the concept. It is to emphasize that getting caught up on lag measures like shooting percentage instead of lead measures like Corsi% or Expected Goal% can be a paralyzing exercise.
So, general managers: If your team is performing well but can’t buy a goal, take note of the above and don’t overreact. But if your team isn’t performing well and can’t buy a goal? Well, that’s a perfect storm of bad, and intervention may be required.