


Aug 13, 2015
A closer look at high-priced NHL defencemen
Two of the more prominent contracts awarded this offseason went to defencemen Johnny Boychuk and Mike Green, both qualifying among the top tier of blueliners that are earning at least $6-million per season. Travis Yost takes a look at this group and still has some questions that he needs answered.
By Travis Yost

Two of the more prominent contracts awarded this offseason went to defencemen. The New York Islanders extended Johnny Boychuk on a mega six-year, $42.5-million deal, and the Detroit Red Wings handed out a three-year, $18-million contract to Mike Green.
Those contracts put them in an interesting crowd – the $6-million AAV Club, as I like to refer to them. Getting into this group isn’t easy. There were only eleven names on the list during the 2014-2015 season, and Johnny Boychuk is the only true induction this year, since Mike Green’s prior deal also qualified.
It goes without saying, but the expectations for both Boychuk and Green are going to be held at or near what the rest of this group does on a year-to-year basis. To illustrate just what kind of standards those are, I pulled some of the team-relative metrics we often look at for defencemen for the eleven defencemen who were top-tier earners at their position in 2014-2015. Our expectations are that elite defenders have considerably positive impact on their respective teams, and for the most part, that holds true.
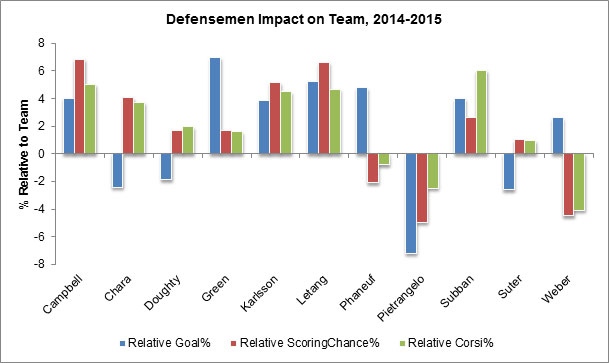
Pretty clear development here: the best defencemen have a strong impact on goal-scoring (+1.6%), scoring chance creation (+1.6%), and possession (+1.9%). This is why they are paid the big bucks.
But, like you, I have a whole bunch of additional thoughts after glancing at the data. I’ve listed them out below in no particular order, and I’m curious to hear your feedback on these points, as well as any additional items that I may not have addressed.
1. It’s difficult to really find a beef with Erik Karlsson winning last season’s Norris Trophy. His team was significantly better by all three metrics with him on the ice (each comfortably clearing our above-referenced averages for the $6-million AAV Club). What’s interesting, though, is just how similar two defencemen – Pittsburgh’s Kris Letang, and Florida’s Brian Campbell – look here. Letang was having an absolutely monstrous season for the Penguins and had the raw point totals that voters love before his season was cut short due to injury. Say what you will about his sometimes-wild, sometimes over-tempo style of play – it clearly has a beneficial impact on Pittsburgh, much like Karlsson has for Ottawa. As for Brian Campbell, I recall a time when the general consensus about his contract was “it’s a disaster, and he’s borderline untradeable”. He’s been a machine for a few years now, though it's fair to wonder if his age – he turned 36 last May – is going to start having a depreciable impact.
2. Zdeno Chara’s one of the three or four guys that really brought new age statistical analysis into the mainstream (also famously in this group: teammate Patrice Bergeron). Their punishing, relentless style of play has always been observable to the eye, but the underlying numbers – like scoring chances and Corsi measurements – really emphasized the kind of control exerted on the game. But last year, albeit a semi-injury-riddled one, was a slip from his usual dominance. Boston only scored 48% of goals with him on the ice (they actually broke-even with him off of the ice), a very un-Chara-like development. For my money he’s still one of the league’s better first-pairing guys, but it's possible he’s been officially eclipsed by guys like the aforementioned Karlsson and P.K. Subban.
3. Mike Green’s goal percentages don’t seem to jive with his scoring chance and possession percentages, but he was still a positive contributor across the board in his final year with Washington. And while he is still part of the $6-million AAV club, it’s important to note that Detroit hedged the risk on his contract by getting him on just a three-year deal. For a guy who led this entire group in per-60 scoring (by both goals and points), that’s a very rational bet.
4. Lastly, If there’s single player who stands out here, it’s Alex Pietrangelo. I’m more than willing to entertain the argument that last year was a total one-off or aberration, but it doesn’t absolve him of the 2014-2015 performance.
a) What’s odd about Pietrangelo’s ugly underlying metrics is that his counting numbers look perfectly fine. As has been the case for five straight seasons now, he posted lofty point totals (seven goals, with thirty-nine helpers) and kept up his pseudo-ironman streak, missing just one game of action.
b) The usual caveats don’t really come into play here, either. We see guys have weird seasons because their PDO is either randomly great or randomly terrible, but Pietrangelo sat right near the league average. A quick check of linemate quality turns up nothing, either: his most common forwards were T.J Oshie, David Backes, and Alex Steen, with the competent Jay Bouwmeester usually attached to his hip.
c) Perhaps we subscribe to Pietrangelo’s Goal% weirdness (St. Louis was a 50% team with him, and 57% team without him) as a total one-year fluke. What happens if we back our sample out to capture the last four years with the Blues? Answer: he’s still in the negative relative to the rest of his team by a full percentage point.
d) Would you believe that the same exact thing happens with Pietrangelo’s ScoringChance%? Because it does. St. Louis has been about 0.5% better at winning the high-quality-shot battle without their defensive backbone, which is honestly difficult to believe. (For a quick reference point, other players over that same timespan: Chara +4.5%, Karlsson +4.2%, Subban +4.1%)
e) I don’t have a single, smoking gun reason why Pietrangelo’s numbers don’t seem to live up to either our expectations or what the eye test would suggest. But his lagging production – relative to other top-tier talents – is real, particularly in the case of last season. What do you make of it, and how can St. Louis remedy the situation?