
Nov 9, 2017
Evaluating the sustainability of hockey’s white-hot shooters
The NHL’s 5-on-5 scoring leaderboard is filled with the usual suspects and some curious names. Travis Yost uses a numbers-based approach to try to differentiate between what’s real and what’s not.
By Travis Yost

One of the big challenges for general managers, coaches, and even fantasy hockey owners is differentiating between what’s real and what’s not.
Most people are inclined to ride the hot hand until that hot hand cools off.
It’s an understandable approach, but try thinking like an executive for a moment. Let’s say a player on the trade block had seen his scoring production drop in recent weeks. If you are an interested buyer, you’ll surely weigh the likelihood of that scoring dip being real versus random fluctuation. If it’s the latter, then maybe there’s a possibility of acquiring a valuable asset at a fraction of the cost.
This type of evaluation is done every single day in the hockey world. Organizations are consistently trying to get ahead of the curve, and the vast majority know all too well about the pitfalls of randomness clouding or skewing their perception. But, we’re also all human – susceptible to recency bias and reactionary thinking.
How do we combat that? As you might have guessed, I’m inclined to recommend a numbers-based approach. These types of quick and dirty analyses aren’t foolproof, but they usually help provide levelheadedness when these player valuation discussions pop up.
Let’s work through a quick example. Through one calendar month of the season, we know there are a bunch of white-hot shooters around the league. The 5-on-5 scoring leaderboard is filled with the usual suspects, like Nikita Kucherov, Alexander Ovechkin, and John Tavares. It’s also filled with some curious names: younger prospects like Adrian Kempe and Clayton Keller, and veteran types like Brian Gibbons.
Whose numbers are real? Qualitatively I’m much more inclined to believe a Kucherov, say, than a Gibbons. But what kind of deviations from reality are we talking about? And how much should we expect those numbers to change as the season progresses?
For goal scorers, we know the two big drivers: individual shot volume and individual shooting talent. For the vast majority of the goal-scoring leaders one month into the season, their shooting percentages are up year-over-year – that shouldn’t surprise anyone. But individual shot rates are a different story. A player who has driven his goal scoring up by way of creating more opportunity (or generating more shots) is more likely to sustain his production than his counterparts.
How are these players trending? Here’s the raw data:
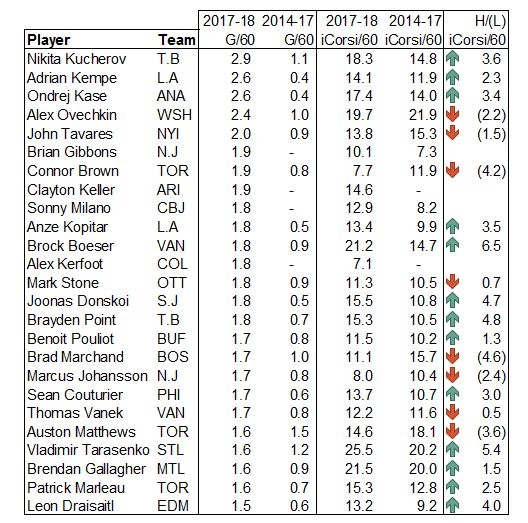
Right out of the gate, there are some interesting findings. Kucherov’s goal-scoring rates are ridiculously and unsustainably up from prior years, yes, but he’s also seen a huge spike in his shot generation rates. It also helps that he’s now playing consistent, regular minutes with Steven Stamkos. So while his rate goal-scoring will step down from where it is right now, there’s plenty of reason to believe he’ll remain one of the league’s most prolific goal scorers.
That same line of thinking is probably also true for Vladimir Tarasenko, Brendan Gallagher and Leon Draisaitl. Here you have three guys in the prime of their career who have seen an influx of scoring talent surrounding them on their own lines. Like they have in the past, they’re living in the offensive zone. One would be shocked if we saw their numbers meaningfully depreciate over time.
On the other side of the ledger, you have a few interesting names. Ovechkin is going to retire as one of the three best goal scorers ever, but it’s still hard to believe in what he’s doing at 5-on-5. His line – and his team for that matter – aren’t nearly as threatening as they have been in years past, and Ovechkin’s shifted into more of a power-play dynamo than an all-situations dynamo in the later stages of his career. I think we should be skeptical of his hold on fourth place in the rate goal-scoring race.
I wouldn’t expect Marcus Johansson or Tavares to stick around either. Johansson has never been a marquee goal scorer and his most common linemates this season include Adam Henrique and Kyle Palmieri – nice players, but not the top-tier talent who could drive Johansson’s numbers upward. Johansson has been very productive in limited minutes (he’s seen his TOI drop by more than two minutes this year), but I don’t know that he’ll ever have the chance or the volume to stay in the hunt.
As for Tavares – well, I think he’s one of the best players in the league, but we have an awful lot of data suggesting he’s good for about 30 goals a season. He already has 12 goals in 15 games, seven of which have come at even-strength. His linemates have remained pretty consistent from the last couple of years, though the addition of some Jordan Eberle minutes has helped. Add that to the fact that he and his line have seen a drop in shot volume, and you have a situation where Tavares (despite being one of the league’s elite) might be a shade overvalued – particularly so by your average fantasy hockey owner.
The last piece is the great unknowns. How does one rate a Clayton Keller, for example? Keller’s off to an insane start in Arizona and was considered one of the most prolific playmakers in his draft class. But Arizona has lived one piece of this before – it was just two years ago that Anthony Duclair was unstoppable for a brief period, riding a ridiculous shooting percentage to a swath of goals. Then the shooting percentage dried up and Duclair suddenly looked a lot less effective. Keller, to his credit, is generating about the same type of shot volume as Auston Matthews. So if you are looking for one data point to semi-support his production, I’d take a hard look at that.
At the end of the day, this is the sort of elementary exercise that can help individuals evaluate deviations in performance. It will be interesting to see is how this leaderboard tracks as the season progresses – and how many of the players we think are truly vulnerable to regression actually slip from the top tier of scorers.