
Sep 14, 2017
The impact of randomness on the NHL standings
Travis Yost examines how variables mostly out of a team’s control may have impacted last year’s standings.
By Travis Yost

One of the things I like to do before the start of a new NHL season is isolate on teams that may have been impacted by randomness in the standings the previous year.
This, of course, is a massive question to answer, and there’s a lot to tease out. What constitutes randomness, and how do we calibrate or set expectations for teams that deviated from expectations in last year’s standings?
One quick and simple method to check this is by looking at the spread between a team’s placement in the standings and a team’s goal differential (all game states) over the course of the season. Goals win games, and mitigating goals against wins games. As teams see their goal differential climb, so too does their place in the standings. It’s precisely why there is such a strong relationship between goal differential and win/loss record.
But it’s not a perfect relationship. Consider some obvious factors. A team that wins 7-1 over 41 games and loses 2-1 over the next 41 games would have a .500 record. A team that wins 1-0 over 41 games and loses 1-0 over the next 41 games would also have a .500 record. Is their team talent the same? Of course not.
Every betting man would argue that the first team – the team that was +205 goals over 82 games – was and is more talented than the second team (+0 goal differential). The records were only the same because of how the goals were bucketed on a game-by-game basis, and nothing else.
Overtime and shootout performance is another factor. Many studies have shown that outcomes in these spots isn’t purely random, but enough to make it difficult to forecast a team’s true talent. Thus, a team with a great overtime/shootout record in one season is far from guaranteed to have that same record in the subsequent year.
Back to goal differential and the impact on the standings for a moment – the relationship between the two is incredibly strong, with goal differential explaining 92 per cent of a team’s points over the course of a year. Each incremental goal is worth about 0.4 points in the standings. As you can see in the table below, a larger spread from zero in goal differential has a meaningful impact on points accumulated:
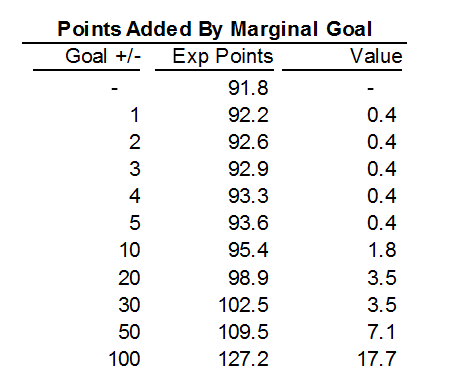
What does this mean? For me, it’s an easy thing to track to if you are a fan or team executive interested in true talent. If my team was 9-1-0 over the first 10 games but +0 in goal differential, I’d assume that my team’s ‘true talent’ in the standings was about 91.8 points – or right near the playoff cut line.
The next logical question we should dig into from here: What does this mean for teams based on last year’s performance? As you can see, the spread on most teams is at or near zero. But a few teams were impacted by that remaining 8 per cent – the 8 per cent that’s not explained by sheer goal differential.
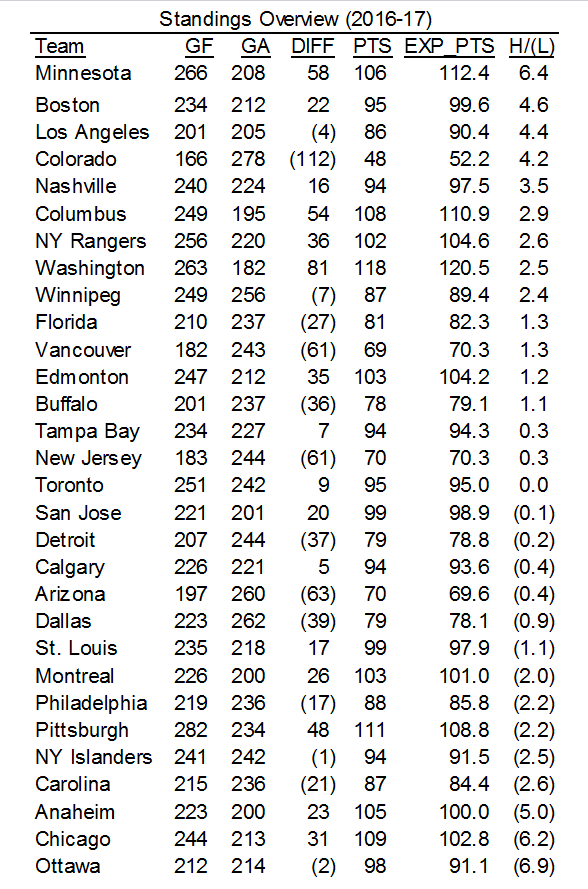
There are about seven teams that I think were impacted in some way by fortune: Minnesota, Boston, Los Angeles, and Colorado on the unlucky end, and Anaheim, Chicago, and Ottawa on the lucky end.
On the positive side of the ledger, you have to like where you are if you are the Minnesota Wild. We’ve talked about a shifting of divisional strength away from the Central in the last couple of years – the majority of the teams in the division have taken some sort of step back – but Minnesota is probably the biggest exception.
What’s interesting is that Central Division rival Chicago is on the other end of the spectrum. The Blackhawks wound up winning the Central last year despite being a ‘true talent’ team of about 102 points – definitely good enough for a playoff spot, but that’s usually the type of performance you see from a team who has a road series in the first round.
Along with Chicago on the negative side, Ottawa sticks out badly. The Senators were a 98-point team last year despite having a negative goal differential. Consider Los Angeles here as a frame of reference: The Kings were only two goals worse over 82 games, but managed to finish 10 points behind Ottawa. Combine this with the fact that Ottawa’s superstar defender Erik Karlsson might miss the first few weeks of the season, and you have a situation where the Senators might be regressing towards the middle of the pack.
Again, this is just one way of looking at how variables mostly out of a team’s control may have impacted last year’s results, but it’s worth checking in on as we set out for forecasting the 2017-18 standings. Stan Bowman and Pierre Dorion might not be fans of this methodology, but the reality is they probably needed to find about six points of player value this off-season in order to meet last year’s expectations.