
Aug 30, 2016
Which historical statistics best predict future scoring rates?
Which historical statistics are the most predictive for future player scoring rates? Travis Yost takes a look, and also takes a crack at forecasting the top scorers in the upcoming NHL season.
By Travis Yost

A few weeks ago, a reader reached out with what I thought to be a reasonably simple question. He wanted to know which historical statistics were the most predictive for future player scoring rates.
My original thought was that the best indicator of future player scoring rates – specifically, 5-on-5 points (per 60 minutes) – was simply 5-on-5 points (per 60 minutes) in the preceding year. This should make intuitive sense: we know scoring is a real and repeatable talent for forwards, so theoretically, great scorers should remain great scorers and poor scorers should remain poor scorers. But, the more I thought about it, the more I became curious about whether my gut answer was the right one.
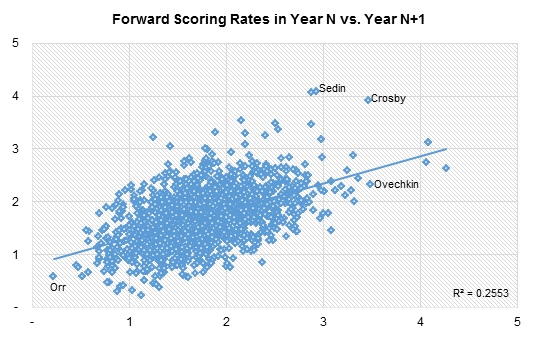
To test if this prevailing theory was still accurate, I took all regular forward data over the last nine seasons (courtesy Corsica) and tested each player’s scoring rates against the same player’s scoring rate in the subsequent year. As you might expect, there’s a positive relationship between the two.
Out of sheer curiosity, I decided to see if 5-on-5 points (per 60 minutes) was still the best predictor of future 5-on-5 points (per 60 minutes). So, I looked at the forecasting competency of another a bunch of other statistics we regularly utilize in this space, and the findings were interesting. (Here, a 1.0 r-squared number means all of the year-to-year variance is explained by the subject metric. A 0.0 r-squared number means none of the year-to-year variance is explained by the subject metric.)
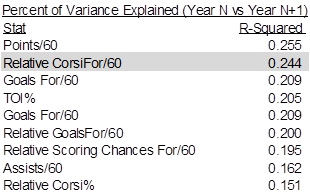
The interesting piece here to me is that while points per 60 is still the best predictor of future points per 60, it’s not nearly as cut and dry as I thought. In fact, Relative CorsiFor/60 – the number of incremental shots a team enjoys when a player is on the ice versus off of the ice – is almost as predictive as actual scoring rates.
Thinking about it more, this also makes a fair bit of sense. Point scoring generally correlates well with one of two things: individual shooting/passing talent, and opportunity. Relative CorsiFor/60 really speaks to the latter of this equation. And the beauty of this metric – much like our per-60 scoring measurement – is that it won’t discriminate against players who enjoy varying degrees of ice time. It simply captures how productive a player is in the time he is allocated at 5-on-5.
The uniqueness of these two measurements (avoiding collinearity) allows us to consider the possibility of using both variables to forecast future scoring, as opposed to simply one measurement versus the other. And by using a combination of the two variables, our model can forecast with a higher level of accuracy.
As for the results: I think the list checks out. Here’s a quick forecasted top-20 scorers using the above criteria.
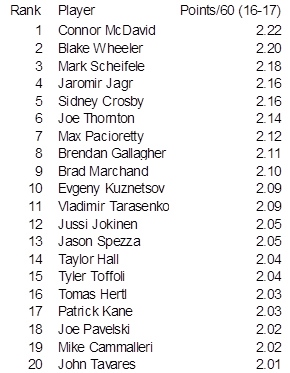
For the most part, this passes my sniff test – most of these guys have been Herculean scorers for years and naturally should hold their own in the 2016-17 season. I thought a few placements were fascinating though. The regression-based model thinks that two Winnipeg Jets players (Blake Wheeler and Mark Scheifele) will have fantastic seasons in the offensive zone, and that the ageless Jaromir Jagr will continue to terrorize goaltenders.
It’s worth pointing out that the model is a bit harsh to top-flight scorers and a bit kind to poor scorers, and will continue to be for as long as players’ scoring rates bounce around from year to year. For reference, the full forecast for the 2016-17 season is here.
It’ll be worth revisiting this post at year end to see where the stat-based approach came close, where it deviated, and whether we can refine our projections through additional criteria that weren’t considered for the purpose of this post.
But, I leave you with one preseason recommendation: it might be time to buy stock into this Connor McDavid fellow. He looks like a keeper.