Aug 27, 2015
Who is the National Hockey League’s best goaltender?
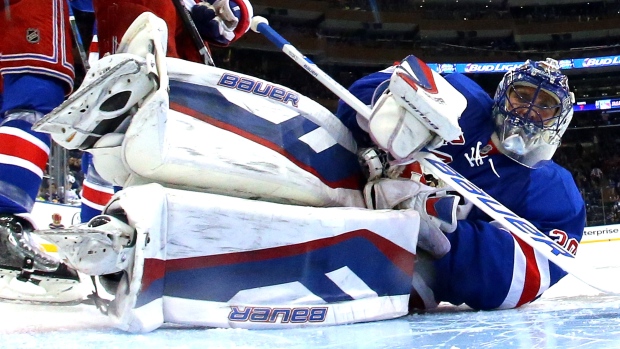
Choosing between Carey Price, Tuukka Rask, or Henrik Lundqvist is like choosing between a lump-sum or structured payout after turning in a winning lottery ticket, TSN’s Travis Yost writes.
By Travis Yost

Who is the National Hockey League’s best goaltender?
It’s an interesting question, and one I struggle to answer conclusively. The regular names that usually filter through this conversation are Montreal’s Carey Price, Boston’s Tuukka Rask, and New York’s Henrik Lundqvist (stick around Kings fans – we’ll get to Jonathan Quick in a bit).
All fine candidates; and depending on the time of day or week, your answer might change. Carey Price has the recency angle for him – he was far and away the league’s best goaltender last season, and I argued vehemently in support of his Hart Trophy candidacy last March. Tuukka Rask, quiet as it is sometimes kept, actually has the league’s best even-strength save percentage (93.4 per cent) over the last five seasons. Henrik Lundqvist isn’t far behind (93.1 percent - third in NHL), and he has an amazing durability element (his 363 games played over the last five years are tops in the NHL) that boosts his stock.
To illustrate just how close the margins are between these three goaltenders, I’ve pulled each of their single game even-strength save percentages over the last five regular seasons. Then, I ran 10,000 simulations for each goaltender based on his performance over that timespan – the idea to expand our sample to a point where we can get a real feel for potentially miniscule disparities between the three elite talents.
How does each goaltender look?

The first thing that jumps off of the page is how the simulated version of Price looks in comparison to the other two goaltenders. Price may be coming off of one of the best single seasons in recent history, but the model has a long memory, and also recalls two so-so seasons in 2011-12 and 2012-13. Going forward, I think there is an awful lot of confidence in Price and his ability to be the world’s best at his craft. But, at least as it pertains to his Eastern Conference rivals in Rask and Lundqvist, the competition is staunch.
As expected, the Rangers goalie looks phenomenal – just look at how often he’s finishing a single-game with a 92 per cent EVSV% or better, and look at how infrequently he bombs out of a game and single-handedly sandbags his team's hope of winning a game.
Now, look at how Rask virtually mirrors Lundqvist’s performance in each save percentage bin. They are virtually identical goaltenders, though judging by the pulse of Hockey Twitter, you wouldn’t necessarily know it. I’m not sure a player has taken more random (and nonsensical flak) in the past few years, especially since, like Lunqdvist, his “bad” games are few and far between.
If you absolutely, positively made me choose a goaltender to win one hockey game in the coming months, I would pick Henrik Lundqvist. The track record is ridiculous, he’s as likely as any player in the league to be healthy in the event that I need him, and the chance he has a one-off ‘bad game’ is minute. But Tuukka Rask is right there, and if Carey Price’s 2014-2015 run is any indication, this is absolutely a three-horse race in the years to come.
Some of you might be curious why that’s not a four-horse race. I mentioned earlier that I’d touch on Jonathan Quick, the man with two Stanley Cups and a Conn Smythe Trophy to his name. He’s earned the reputation as a big-game goalie, and is paid handsomely to rank among the league’s elite.
How does Quick compare to our three goaltenders here?

Quick is a reliable goaltender, but being in this simulation against three of the game’s best is never a kind comparison. As you might have guessed, his middling stop rates over the past few years really hurt his candidacy in our model. Good? Yes. Great? No.
One final thought on this – I mentioned earlier that Rask and Lundqvist in particular very rarely have those brutal games that can instantly undercut a team’s chances of winning a game. I think there’s value added in showing you what that looks like, so I’ve tweaked the model a bit to include one more goaltender. SimPavelec.

Again, the model doesn’t forget the past.
Just look at the number of games in which Ondrej Pavelec posted an even-strength save percentage at or under 80 per cent. The model indicates that Pavelec would turn in one of these games about 7.8 per cent of the time, or about six times a season. On the other hand, a goaltender like Lundqvist or Rask would turn in one of those games once or twice a season.
Obvious point is obvious: Pavelec isn’t the kind of goalie Price, Rask, or Lundqvist is. But I think it does speak to how valuable these top-end guys are, assuming you can find them. Worst case scenario, you are never out of a game when they’re in the net. Best case, they steal you game after game after game.
The Takeaway
Choosing between Carey Price, Tuukka Rask, or Henrik Lundqvist is like choosing between a lump-sum or structured payout after turning in a winning lottery ticket. At the end of the day, there’s no wrong answer. For the time being, I’ll choose Lundqvist. Ask me in November and I might have a completely different response.


