
Sep 6, 2016
A first crack at predicting the 2016-17 NHL standings
Travis Yost jumps into the prognostication business by calculating goal differential estimates for every team in the league
By Travis Yost

The beauty of hockey, like many sports, is that the equation for how we define success is reasonably simple: We care about wins. The way to earn wins is by scoring more goals than the other team. Because of that, much of the focus on hockey analytics – regardless of complexity – is spent examining the things that drive goal differentials.
The cruelty of hockey is in the fact that out-scoring your competition over the course of a season does not guarantee a successful year. In fact, it may not even guarantee you a playoff berth. Take last season for example. The Boston Bruins out-scored their competition by 10 goals last year and missed the playoffs. The Minnesota Wild out-scored their competition by the same amount of goals and made the playoffs. The Detroit Red Wings were out-scored by their competition to the tune of 13 goals last season and made the postseason.
Did Detroit have a more successful team last year than Boston? If you just looked at the standings, the answer is yes – they reached the postseason while Boston didn’t. But take a step back, and it’s hard to make that argument. The Bruins were 23 net goals better than the Red Wings last year, which isn’t insignificant.
Plenty of our time is spent looking at things like goal differentials as opposed to wins and losses, not dissimilar to baseball’s focus on run differential (also over wins and losses). Not only does it more effectively capture true team talent, but it also does a decent job of separating the lucky from the truly unlucky.
So, how can we go about forecasting goal differential, and how would it play a role in determining what we envision to be our best dart throw at the 2016-17 standings? There are a million different variables in hockey, but you can reduce the sport down to four criteria across three game states (including even-strength, power play, and penalty kill).
1. How well do you generate offence? (Shots For/60)
2. How well do you convert on offensive chances? (Shooting Percentage)
3. How well do you slow down the opposition’s offence? (Shots Against/60)
4. How well does your goaltender stop the opposition? (Save Percentage)
Since we now have about 10 years of team-level data and know the pervasiveness of each of these metrics, we can regress each statistic year-over-year for each of the three game states to separate true/repeatable talent from pure noise.
That gives us goal differential estimates for every team in the league based on prior year performance. Here’s what the regressed 2016-17 standings look like for the Eastern Conference:
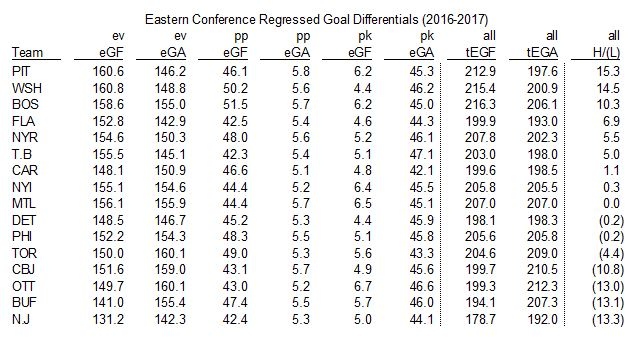
There are not a ton of surprises in the top half of the standings. The model looks favourably on teams like the Pittsburgh Penguins and Washington Capitals, a pair of teams who really dominate most game states and had a ton of success last year. More interesting here, I think, are two teams: the aforementioned Bruins, and the Carolina Hurricanes.
The model has the Bruins playing about as well as they did a year ago, but in this simulation they actually float into the top half of playoff performers for the upcoming season. It’s not because they’re a great 5-on-5 team – their goal differential there is well behind both Pittsburgh and Washington, and also behind a couple of teams below them, including Florida and Tampa Bay. But the model thinks they should be an above-average special teams unit, with one of the league’s most productive power plays and most stifling penalty kills.
The other interesting team here is the Hurricanes. We have talked at length about this team – a scrappy bunch that play a tremendous amount of time in the opposition’s third, but is down in both goaltending talent and individual shooting talent, which killed them in the standings last year. Because shot generation is far more predictive and repeatable than things like shooting and save percentages, it figures a team like Carolina should improve by next season, breaking even in the goal-differential department and likely chasing a playoff berth.
Let’s head over to the Western Conference and see if there are any surprises.
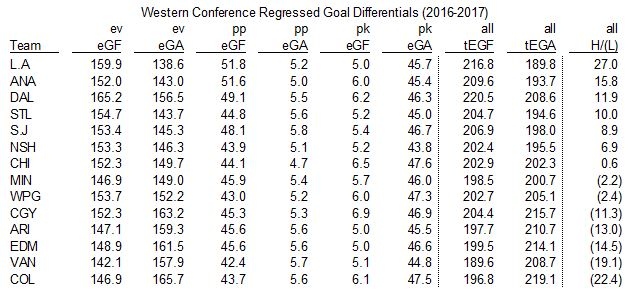
Here, we see a pretty substantial bounce-back by the Los Angeles Kings to take over the top spot in the Western Conference. Beyond that, it’s pretty much looking like a fight between our usual suspects from last season. The one interesting piece here to me is the variance between Chicago, Minnesota, and Winnipeg – three teams separated by about two total goals.
The Blackhawks are going to be one of the interesting case studies again this season. Despite a handful of the league’s best players, there were clear warning signs that Chicago was vulnerable in the Western Conference last season, so their first-round exit wasn’t completely shocking. Remember: Chicago was a negative goal-differential team at 5-on-5 last season, sandwiched between the likes of Montreal and Arizona. There’s no reason this roster shouldn’t rebound next season, but last year was the first time in close to a decade that we saw them look like a mediocre hockey club.
One other point of interest: The spread of talent in the Western Conference seems to be much larger than the spread of talent in the Eastern Conference. In the East, you have the best team about 30 goals or so better than the worst team. In the West, that number is almost 50.
I’ll end with a quick caveat on this type of forecasting. While year-over-year predictions generally do well due to the limited roster turnover, the model will be blind to major off-season moves. So, if you are the type that thinks a team like Nashville should tremendously improve by way of swapping Shea Weber for P.K. Subban (as I am), that’s not captured here. If you are the type who thinks a team like Anaheim is really going to suffer by way of swapping Bruce Boudreau for Randy Carlyle – well, again, not captured here.
We’ll revisit this piece mid-season and make adjustments with the first 40 or so games of the season to see how the predictions have changed. But for now, that’s my high-level stab at what we can expect this year.