
Apr 7, 2016
An attempt to measure true coaching impact
Travis Yost examines the relationship between line combinations and successful play in an attempt to find out which NHL bench bosses have a feel for what works and what doesn’t
By Travis Yost

I can’t say that I’m surprised by the results of the NHL head coaches’ poll assembled by TSN’s own Bob McKenzie.
The Hockey Insider asked 27 coaches who they thought was most deserving of this year’s Jack Adams Award, and they responded (in order): Barry Trotz of the Washington Capitals, Gerard Gallant of the Florida Panthers, Lindy Ruff of the Dallas Stars, Bruce Boudreau of the Anaheim Ducks, and Ken Hitchcock of the St. Louis Blues.
I think there’s a pretty compelling case to be made for all five guys. After all, the list of prior Jack Adams Award winners includes guys — Patrick Roy and Bob Hartley come to mind — who rode unsustainable puck-luck benders to a prominent finish in the standings.
If anything, the Roy and Hartley wins show how difficult it is to measure true coaching impact. So much of a coach’s success (and failure) is predicated on the talent assembled for him, and our expectations of the team going into the season. That’s generally why you see the Jack Adams given out to one of two candidates every year: a coach whose team took an unsuspecting leap forward, or a coach of one of the league’s best teams.
I’ve thought a lot about how to measure coaching impact on teams because I think it’s a very important element to consider for front offices. How sure are executives that they are getting the most out of the talent they have assembled? How do we know that coaches are making optimal lineup decisions with the players available?
There’s not a lot fans are privy to with respect to coaching, but one thing I think can be measured pertains to lineup decisions over the course of the season. Are the right guys being broken up? Are the wrong guys being split in rapid fashion? Does a coach genuinely have an eye for what’s working and what’s not?
This is measurable. Let’s think about line combinations for a moment. Every team’s had dozens of line combinations throughout the season – some have lasted for a long time, some were broken up very quickly. There should be some relationship between the combinations that stuck and successful play. Conversely, one would assume that the line combinations that were split early on were submarining team’s performance.
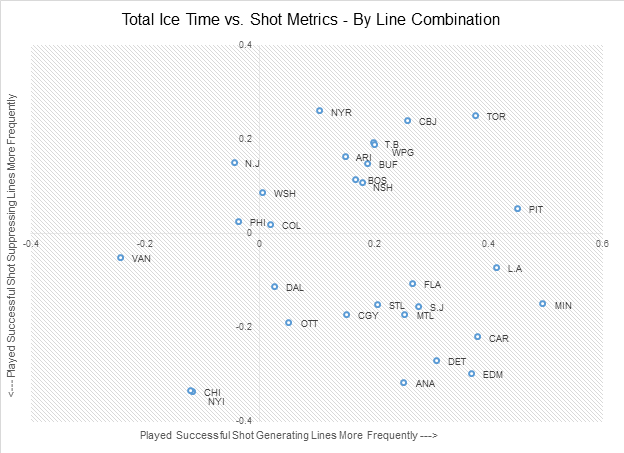
So, let’s look at those relationships. I ran two simple correlations: total ice-time together versus offensive performance together and total ice-time together versus defensive performance together. Which team managed their lineups most properly?
I think the data in here is fascinating for a number of reasons, but mostly because it gives us a bit of insight into what coaches – either consciously or sub-consciously – tend to value across their team.
Let’s look at shot generation first, which runs across our horizontal axis. Teams on the right appear to very much value line combinations that generate swaths of shots and scoring chances – those teams being Minnesota, Pittsburgh, Los Angeles, Toronto, and Carolina.
It’s not lost on me that at least four of these teams take hockey analytics incredibly seriously, and the fifth team – Los Angeles – is the absolute master of 5-on-5 performance. It’s also not lost on me that in this group you have two exceptional coaches in Mike Babcock and Darryl Sutter, two coaches who have commandeered big mid-season turnarounds in Mike Sullivan and John Torchetti, and one coach who has been so good this year he’s earned the right to coach Canada at the world championships.
On the other end of the spectrum, I can’t figure out what Vancouver was trying to accomplish this season. Most of the teams, either knowingly or unknowingly, played their better line combinations more than their weaker line combinations. In Vancouver it was legitimately the opposite from a shot generation standpoint – the groups that generated less offence seemed to stick around. Why? I’m not sure I have a good answer to that question.
Let’s look at shot suppression now, which runs across our vertical axis. Here we want to see a negative correlation, so teams toward the bottom appear to play combinations more that suppress shots and chances against.
Again, look at the coaches who populate this end of the list. Joel Quenneville and Bruce Boudreau appear to be the most averse to lines that bleed shots, as well as (and a bit surprisingly, I might add) Jack Capuano. In this group you find hundreds and hundreds of NHL wins – plus my preferred Jack Adams candidate.
The other side of the coin is just as interesting. Babcock’s team is here, which is surprising but somewhat explainable – the team did trade away a few of their competent defensive wingers, which kind of obfuscates the data. It’s far less surprising to see Alain Vigneault and John Tortorella here. The Rangers have been nothing short of a catastrophe in the defensive zone for most of the season, and Columbus is coached by a man who adheres to the principles of structured shot-blocking above all else. Those seem much, much more in line with what we would think.
I’ll caveat this analysis by saying it’s far from perfect – trades, roster turnover, and injuries can muddy the relationships a fair bit. That said, I do think it can speak reasonably well to coaches at both poles. When you’re positioned like a Carolina, Anaheim or Los Angeles here, I’m pretty comfortable in saying that the head coach has a pulse for what works and what doesn’t.
As for a team like Vancouver or New York? Well, their preferred deployment choices seem rather puzzling, since less frequently used lines generally outperformed more frequently used lines. To that end, it certainly seems like some coaching criticism may be warranted and justified.