Dec 6, 2016
Burns belongs with Karlsson in conversation about NHL’s best blueliner
The numbers show San Jose Sharks star defenceman Brent Burns has been a dominant force in point and shot generation over the last three seasons, Travis Yost writes.
By Travis Yost

It’s not often that we talk about a player changing the way we think about how a position should be played.
But, it’s not often that players like Brent Burns or Erik Karlsson come along.
Burns’ emergence might be the result of a perfect storm in San Jose: A talented player finding the right guys to play with, a perfectly timed transition from winger to blueliner and an offence that plays an exceptional brand of inside/out hockey in the offensive zone. Whatever it is, Burns and the Sharks are a match made in heaven.
He’s become as much a staple of their attack as Joe Thornton and Joe Pavelski. For as much as we have talked (rightfully) about Karlsson revolutionizing the position, it’s worth pointing out that Burns has had a similar career arc.
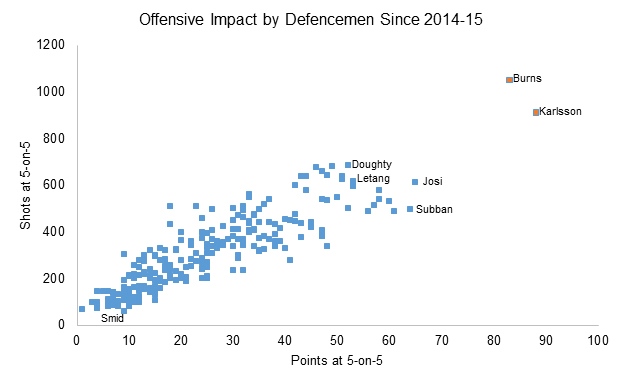
I don’t want to understate this, so I’ll show it in a simple scatter plot below. Horizontally, we have the number of points accumulated by regular defenders since the 2014-15 season. Vertically, we have the number of shots generated by regular defenders in the same timeframe.
Here’s what that looks like:

My favorite thing about this is that your truly elite offensive defencemen – guys like Drew Doughty, Kris Letang, Roman Josi, and P.K. Subban – are about half as impactful as Burns and Karlsson have been by point/shot generation over the last three seasons.
My second favorite thing about this is that for all of the commentary about Karlsson being dynamite, I think we have sold Burns a bit short. It’s true that Karlsson has outscored him over the last few years at 5-on-5. But Burns actually has a pretty sizable gap by shot volume – he’s generated 140 more shots than Karlsson over the interval, which is pretty incredible, all things considered.
It’s worth mentioning that these are volume numbers, meaning players who play more have a higher chance of racking up big numbers. But two counterpoints there. One, durability is a real thing. Burns’ ability to stay on the ice (he has not missed a single regular-season game since the opening of the 2014-15 season) is real and valuable. Two, rate stats look even better for Burns. Not only does he lead in shots generated per 60 minutes (18.78), but he also leads in point scoring per 60 minutes (1.48), even ahead of the aforementioned Karlsson.
So we know that Burns drives absurd individual production. An interesting question is how much incremental value that provides to San Jose. If Burns is taking away shots from his teammates (or if his team’s performance is generally worse when he’s on the ice and improves when he’s off of the ice), all of this is for naught.
It’s one of the big reasons why arguments have been made in support of Karlsson’s Norris candidacies – not only is he a generational offensive talent at his position, but his teammates also consistently perform demonstrably better when they’re playing with him.
Is the same true for Burns? Well, here are some on-ice versus off-ice splits for San Jose and Burns. I’ve included Karlsson and Ottawa for the sake of comparison (data via Corsica):

Burns and Karlsson both see their teams playing better hockey when they are out there, and it’s true by any measurement – shots, scoring chances, goals, you name it. Karlsson has more disparate numbers, but I think at least part of that is driven by the fact that Ottawa’s depth talent over the last couple of years has been woeful, while San Jose’s bottom-six groups have generally pulled their weight. Still, these numbers are always indicative of quality first-pairing talent – if you can favourably drive the run-of-play, you’re going to be worth your weight in gold.
Karlsson seems like a shoe-in for another Norris Trophy finalist position. The question is whether or not Burns should be elevated to that status. You look at this year’s play – stunningly similar to strong performances in prior periods – and it becomes increasingly difficult to keep him out of the conversation.
Oh, and by the way: these two square off on Dec. 7 in San Jose. You might want to stay up late for that one.

