

Oct 5, 2018
How large is the pool of Stanley Cup contenders?
Finishing as one of the four best teams in the standings has meant about a 55 per cent chance at winning the Stanley Cup in the modern era, Travis Yost writes.
By Travis Yost

Once every five seasons.
That’s how frequently the best team from the regular season in the National Hockey League wins the Stanley Cup, which is something to keep in mind with the 2018-19 season now underway.
Predictions and forecasts are flying about who will hoist Lord Stanley next spring. Generally speaking, the favourites have been consolidated to the same handful of teams – Tampa Bay, Winnipeg, San Jose and Nashville appear to be this year’s popular choices. (By the way, I like the Lightning.)
In light of the fact that the league’s best team has a much better chance of not winning the Stanley Cup than winning it, I started thinking about expanding on the late Tore Purdy’s analysis. Purdy's conclusion was reasonably grim to the extent that being the Presidents’ Trophy winner only gave you a small chance at winning the Stanley Cup.
But what if we clustered teams and treated them as having similar or comparable odds? Whether you like Tampa Bay or any other team to win the Stanley Cup this season, differentiation in the NHL is awfully difficult.
I mentioned earlier that consensus for this year’s Cup winners seemed to centre on four teams. If I asked you for a Stanley Cup favourite at the end of the 2017-18 regular season, I probably would have received another cluster of teams. Last year, eight teams finished with 105 or more points – all potential Cup candidates.
Let’s take a look at how many Stanley Cup winners come by way of placement of finish in the standings. The work has already been done to answer the question of how frequently the best team wins, but I was curious to see how many slots down the standings we would need to go to encompass the majority of Stanley Cup winners. The results may surprise you.
First, here are Stanley Cup winners by seed league-wide since the 2004 lockout. This is cumulative, so a “1” would indicate all teams who finished at the top of the league, “2” would indicate all teams who finished second or better, and so on. (These results keep in mind are descriptive and aren’t normalized or smoothed in any way.)
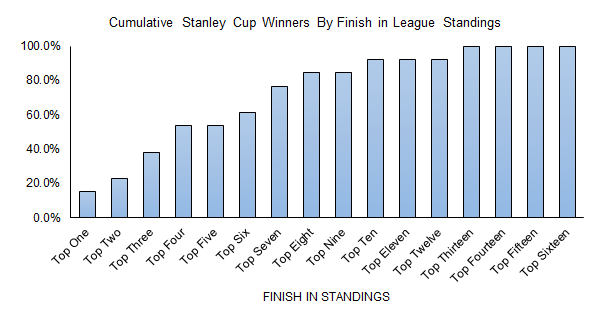
To the hardcore hockey fan this may not be as surprising but these results, at least in contrast to other major sports leagues, are still stunning.
Finishing as one of the four best teams in the league in the modern era has meant about a 55 per cent chance at winning the Stanley Cup – take it to top seven league wide and you are now covering 80 per cent of Cup winners (The recent outlier here of course is 2011-12 Los Angeles; the Kings finished eighth in the West and 13th in the league).
While those numbers seem high, they pale in comparison to most other leagues. Consider the NBA as a parallel: over the same timeframe, nearly 80 per cent of champions finished in the top three of the league. The NBA hasn't had a single winner outside of the top five since the 2003-04 Detroit Pistons.
There are a number of takeaways from this. First, obviously, is that parity is still king in the NHL. Differentiating between the best and, say, third-best team is generally an impossible task. The ‘loser point’ – the third point allocated during the regular season when games end in overtime or the shootout – hasn’t helped in any way on the differentiation front.
From there you have all of the randomness incorporated with playoff hockey. What can happen in a seven-game series? Well, pretty much anything. The two best teams by pure goal differential in the modern era – the 2009-10 Washington Capitals +(85) and the 2013-14 Boston Bruins (+84) – were both eliminated by the Montreal Canadiens before even reaching the Conference Final.
From hot goalies to poor shooting luck to unfavourable bounces and the like, playoff hockey can offer upsets aplenty. And while that may not help reward the best team in their quest to win a title, it certainly does create drama.
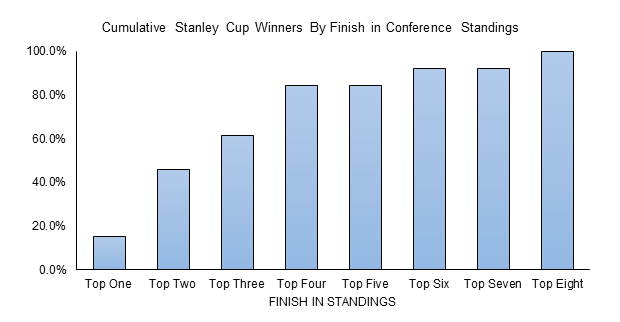
The one saving grace here is that there’s some collinearity with finish in the standings and chance at winning a title. You may not need to come in as the league’s first-overall seed, but you probably need to finish in the top half of your conference to have a real shot.
In fact, let’s look at the same graph as earlier but reframed at the conference level. Here it’s pretty clear – 85 per cent of Stanley Cup winners come from the top-half of each conference.
My point being: There is probably pretty good reason for why you see so many different teams picked as Stanley Cup winners in the preseason and then again right before the playoffs begin. Many teams have a real shot. But based on this type of research, true contenders are generally isolated to the ones finishing near the top of the standings in their respective conferences. Perhaps the best way to think about it: if you are the home team in the first-round of a playoff series, you are very seriously in the championship mix.
Now, we wait to watch the separation of the contenders and pretenders unfold.
Enjoy the season!