
Oct 29, 2018
How puck luck impacts the NHL standings
The Ducks and Hurricanes are two great examples of just how much a team’s shooting or save percentage luck can impact their position in the standings, Travis Yost writes.
By Travis Yost

It seems like no one is happy in Anaheim despite an injury-depleted roster managing a .500 start to the regular season.
That’s because the results in the standings have been kind, considering how poorly the Ducks have played. A typical Ducks game this season has seen Anaheim attempt 46 shots at their opponent’s net while their opponents return 71 shots of their own. Those are mind-boggling margins and indicative of how much of a struggle it has been for Anaheim to get out of their defensive zone.
So how have they held on in the standings? The one word (and maybe only word) is goaltending. John Gibson is an early Vezina Trophy favourite, full stop. It’s a classic case of a team getting by on the percentages and the percentages only; usually, these runs turn into pixie dust with enough games.
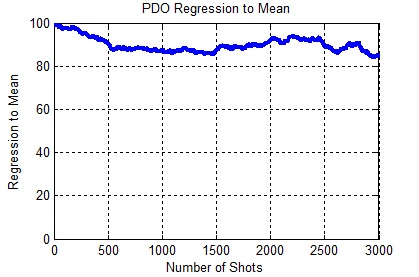
The percentages, of course, refer to on-ice shooting and on-ice save percentage – two components that heavily impact outcomes of individual games, but are heavily susceptible to randomness and rarely indicative of a specific team talent. (Combined, these components have historically been aggregated to create PDO, a measure of reference to how “lucky” or “unlucky” a team may be by the percentages.)
PDO was meant to be a quick reference tool, but I’ve struggled with how to improve it for a few years now. There are obvious limitations. First, on-ice shooting percentage is much more random than on-ice save percentage, relatively speaking (and so, aggregating the two rarely seems appropriate). Second, not all goals are created equal and that can have a disparate impact on how we interpret PDO and the impact it has on a team’s position in the standings.
Consider this example. Imagine you have one team that shoots 0 per cent, then 20 per cent, every other game. Imagine you have another team that shoots 10 per cent every game, on the same degree of shot volume. Which team will have the better record? It’s likely the latter. Why? The team that shoots 0 per cent will lose half of their games. The other half they’ll likely win, but the value of each marginal goal in those games has diminishing returns. (What’s the difference between winning 4-1 and 5-1? Not much.) The 10 per cent shooting team, though, will likely score around three goals per game and consequently win the majority of hockey games they play.
Ultimately what we care about is how the percentages are affecting a team’s position in the standings. Nothing more, nothing less. We know the percentages drive wins and losses, but we should be able to better interpret just how much a team’s shooting or save percentage luck has impacted their positioning. Moreover, we should be able to answer another question: Knowing what shooting and save percentage luck a team has had, how many points should they have accumulated in the standings?
Since we know each team’s on-ice shooting and save percentages at the individual game level and historically know the relationship between each measure and the points they have accumulated in the standings, we can regress the components against standings points to understand which teams are truly getting lucky and which aren’t.
Historically, this is how single game shooting and save percentages drive expected point accumulation in the standings:
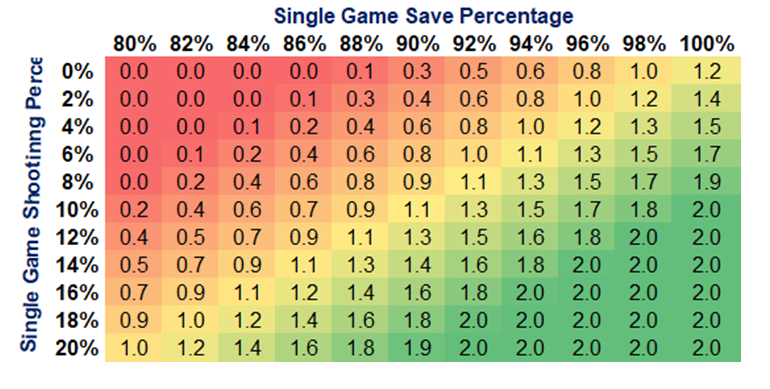
You can see that save percentage is worth a little bit more than shooting percentage per game, which makes sense. But when a team is on a heater and getting bounces on both sides of the ice, you can see how difficult it is for them to be defeated.
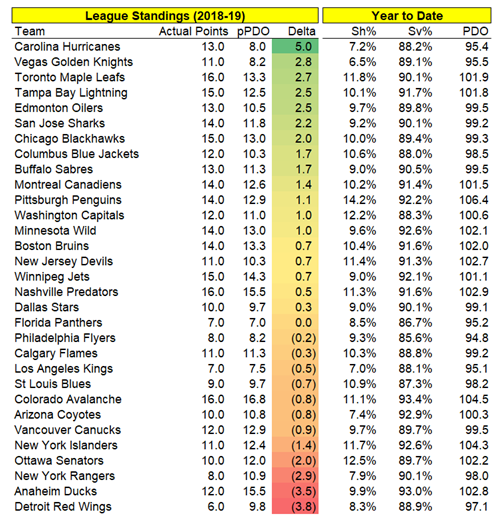
With that table in mind, let’s regress the 2018 standings by game-by-game PDO. Here, ‘Actual Points’ indicates what the team has accumulated to date, ‘pPDO’ indicates what a team should have accumulated based on the percentages, and ‘Delta’ indicates the difference between the two.
Cool. So what does it all mean?
Let’s focus on Anaheim as a quick example here. The Ducks are shooting at a normal rate, but their goaltending has been otherworldly, stopping 93.0 per cent of shots. Teams can realize these sorts of numbers in small stretches, but that tends to wash away over long stretches.
Anaheim does have a bit of a safeguard to the extent that their starting goaltender is a legitimate Vezina Trophy candidate, but even a goalie of his talent may only partially be able to sustain this type of run.
Based on their individual game percentage components, here’s what Anaheim’s season looks like on a cumulative basis. As you can see, they missed substantial opportunity between games eight and 12. There, the Ducks had fantastic shooting and save percentage performance, yet failed to accumulate a single point in the standings.
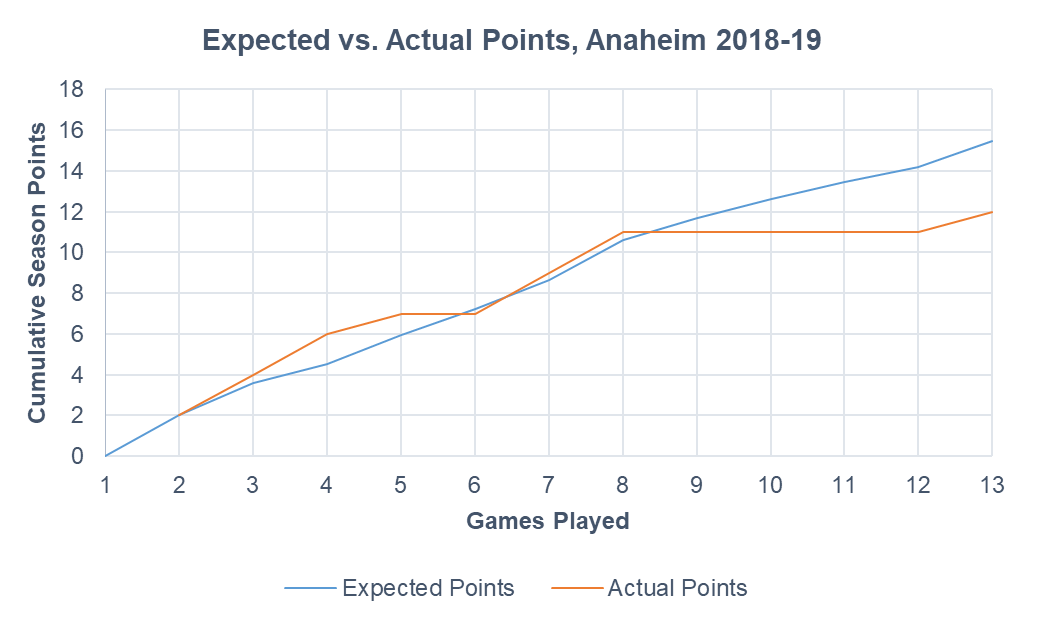
How can a team that’s shooting the puck reasonably well and stopping the puck so frequently still be struggling in the standings? There are only a few reasonable answers to that question, but in Anaheim’s case, there is just one. The Ducks are outshot so substantially on a game-to-game basis that opponents are eliminating their favourable variance by dominating control of the puck.
A team with Anaheim’s puck luck season-to-date should be leading the Pacific Division with close to 16 points; instead, they are hanging around in the middle of the pack, having already traded off four points in the standings.
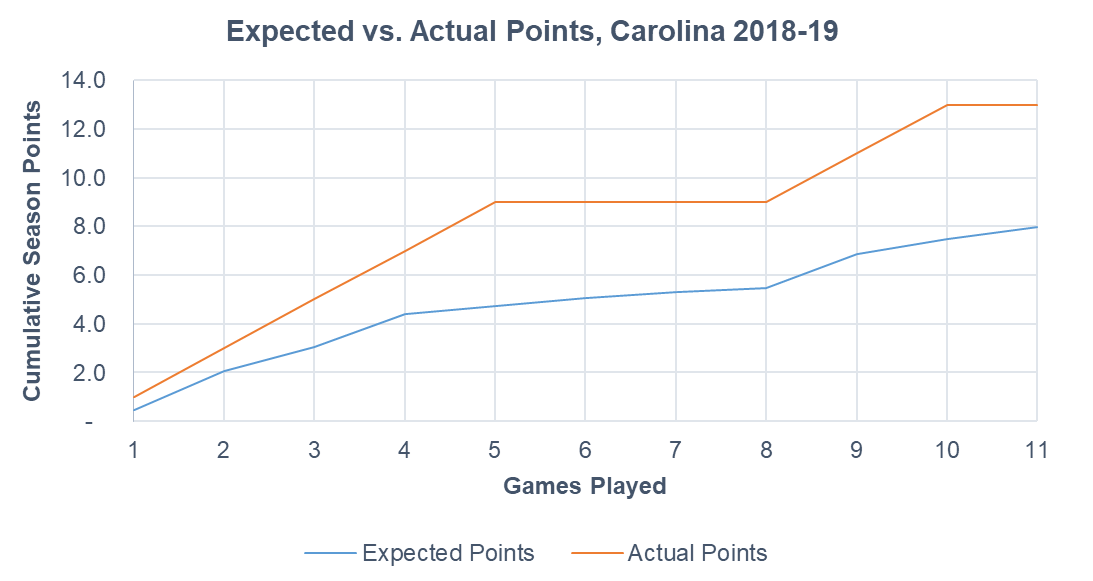
Now let’s look at the other side of the spectrum. Carolina is clearly the team with the biggest deviation in the league, and that shouldn’t be particularly surprising. The Hurricanes have had better shooting luck this season, but the goaltending has still been a real drag on performance. Think about that statement for a moment: Carolina, despite being the league’s early season surprise and firmly in a playoff spot in the Metropolitan Division, has been let down by goaltending.
How is that possible? Let’s look at their expected versus actual points first:
The secret behind Carolina’s success is that they dominate the puck. They are getting a league-leading 62 per cent of the shots and, unlike prior seasons, are finding the back of the net with some regularity. It’s a good thing the Hurricanes do own the puck that much, though. They need to offset the league’s worst penalty kill, season-to-date – a group that is killing off just 67 per cent of opponent power plays.
That’s why our standings expectations are so much lower for Carolina than where they actually sit today. If you had a team giving up a goal on, quite literally, one of every three power plays against, you’d think the team would be toast. But the Hurricanes are so ahead of their opponents in other game states that they are able to mostly cover for it. So while Carolina is again carrying a very low PDO, they’ve been able to put critical points into the standings.
I’d be remiss to not point out one of the more amusing games to date featured this very Carolina team back on Oct. 13. The Hurricanes had a nearly fatal 82 per cent save percentage that night, giving up four goals to a Minnesota Wild team that has been punchless most of the season. For most teams on most nights, that’s a guaranteed loss. But the Hurricanes out-attempted the Wild 83 to 34 – yes, 83 to 34 – en route to a one-goal victory. That’s one way to beat the percentages.
These are all things to keep in mind when we talk about how randomness can impact the standings and how teams capitalize (or fail to capitalize) on their situations. Puck luck doesn’t mean all that much if you aren’t making the most of it.