
Feb 11, 2021
Is something up with the NHL’s play-by-play data?
Could something be wrong with the way the National Hockey League is currently collecting its play-by-play data? Travis Yost takes a closer look.
By Travis Yost

What is going on with the NHL’s play-by-play data?
It’s something I’ve grown increasingly curious about over the past week or so, and a game on Wednesday night between the Toronto Maple Leafs and Montreal Canadiens offered a corroborating data point.
An astute observer noticed that the play-by-play data — the foundation for all historical counting measures and advanced measurements alike – was not matching the run of play. This data is collected for each game by individuals (or trackers) in home arenas as part of the NHL’s Real Time Scoring System.
In this particular case, Leafs centre Auston Matthews won a defensive zone draw, starting the transition up ice. Toronto defenceman Morgan Rielly attempted a shot in the offensive zone, and a full minute later after the faceoff was won, Canadiens goalie Carey Price froze the puck. But Rielly was never credited with a shot of any kind. Also of note: Montreal forward Nick Suzuki’s hit on Leafs defenceman T.J. Brodie was not recorded, nor was Suzuki’s earlier turnover.
Humans, not robots, are tracking the ultra-fast action in real-time. There is no expectation of perfection – in fact, the birth of hockey analytics was married to the reality of making adjustments to the data sets to improve quality. One obvious example? Combating home recording bias.
But there’s something unique about this season that makes me wonder if the issue has manifested in a bigger way. It wouldn’t be the first time that an issue was identified in this area. Just last season shot location data suddenly (and quietly) changed. When the broader stats community identified the issue, the NHL rallied to fix the problem and return shot location data to baseline.
Let’s take a look at the NHL this season compared to the beginning of the NHL’s Real Time Scoring System data, this time with a focus on offensive shot volume. (I’ve also added giveaway and taking data, notoriously less accurate than some of the other data we rely on, but I think it illustrates an important point).
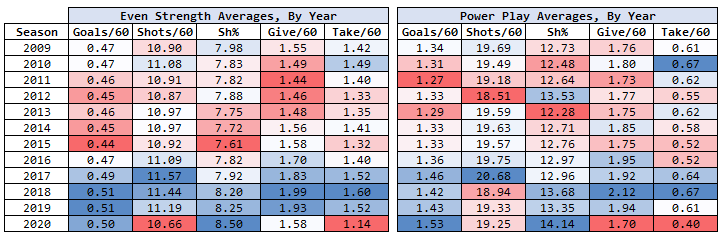
I broke the data sets out by game state because I think there are peculiarities in the tracking when it comes to even strength play, though I’m not smart enough to figure out why.
If you look at the data sets, you see strong collinearity with increasing offensive production over the years – teams are taking more shots, they’re taking those shots from more dangerous areas, and they’re scoring more frequently. (It’s a big reason why league save percentages are down, year after year).
This season, teams are still scoring in line with prior years at even strength, and quite a bit more on the power play. But take a look at shot generation at even strength, which is down five per cent year-over-year and at a 12-year low. Consequently, shooting percentage is at a 12-year high.
That alone means little – it’s certainly possible teams have suddenly become more selective about where they generate these shots at even strength, trading quantity in for heaps of quality. But there are reasons to question that data. Among other things: teams appear to be wholly abandoning that strategy when it comes to the power play, generating shots in line with prior years and scoring goals at a considerably higher rate.
Other measures that have to carry a high level of accuracy, like penalties for and against, remain right in line with historical averages. And perhaps most notably, secondary measures – like even-strength takeaways – are down at such a considerable rate (25 per cent year-over-year) that they raise more eyebrows.
It’s not clear what the root cause of this is, or why there seems to be differentiation between even-strength data (which has deviated from recent years in competing directions) and power-play data (which is in line with recent years). But there has either been a considerable shift in offensive strategy around the league, or the work product of the trackers has changed.
In the grand scheme of things, this doesn’t appear a significant issue – there is still heaps of data being captured, and our understanding of what’s going on at the player and team level through these trackers remains strong.
But it does appear that we are losing data in some capacity. To that end, I invite my readers to send over any theory they have.
Data via NHL.com, Hockey Reference, Evolving Hockey