
Apr 4, 2022
The NHL is experiencing an offensive renaissance
Elite offensive teams are fuelling a scoring surge that shows no sign of slowing as the hockey calendar inches towards the playoffs, Travis Yost writes.
By Travis Yost

A few weeks ago, we observed some significant weakness in goaltending performance across the National Hockey League.
The findings were myriad – backup goaltenders were playing proportionally more, typically elite netminders had seen sharp drawdowns in performance, and so on. And, when goaltending weakens, scoring naturally increases.
But in the modern era of hockey, defence and goaltending have generally won the day. Most scoring outbursts across the league are short-lived, and doubly so as the regular season comes to a close. One of the most predictable in-season trends, in fact, is that scoring decreases as the hockey calendar inches towards the playoffs.
But not this year. This season we are seeing divergence, with scoring continuing to rip to the upside. Don’t just take my word for it. Look at this extraordinary graph from the start of the 2021-22 regular season through the first weekend in April. (Note: I included expected goal rates as well to show this isn’t just short-term shooting percentage-driven.)
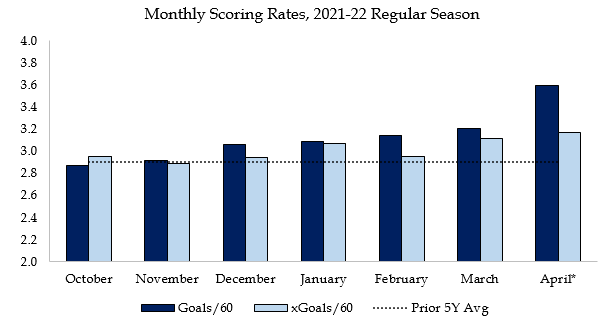
April’s data may be muddied a bit by a smaller sample of games played, but it’s indicative of a broader six-month uptrend for the league, one that’s seen recent historical averages beaten by comfortable margins each month. Again, goaltending could be driving the bus here: platoon and backup options playing more in a relatively more compressed schedule with clustered games is a recipe for higher scoring.
But that doesn’t explain why elite goaltenders we have watched for years, like Anaheim’s John Gibson and Winnipeg’s Connor Hellebuyck (as just two examples), have also seen save percentage regression. Anyone can underperform in a given season, but it’s curious that the majority of returning starting goaltenders have seen a dip in play. So, we ask: What else is going on?
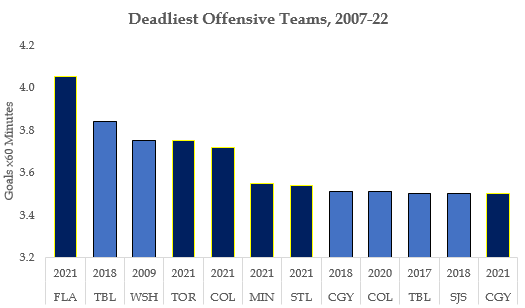
I suspect the other part of this story is that the NHL’s elite teams have distanced themselves offensively from the rest of the pack. In any given season, there’s always a team or two that can seemingly score at will – the dynastic Chicago Blackhawks, San Jose Sharks, Washington Capitals, and Tampa Bay Lightning have all exemplified this over the course of recent seasons.
But this year, we see several teams possess that capability. Six teams – the Florida Panthers, Toronto Maple Leafs, Colorado Avalanche, Minnesota Wild, St. Louis Blues, and Calgary Flames – are averaging 3.5 goals per game. That’s the same number of teams who have hit that mark in the prior 15 seasons.
What do we know about these teams? They are immensely talented, but they are also incredibly deep.
One of the key evolutions of the sport in the past two decades or so is a realization that talent and skill at depth positions isn’t just nice to have; it’s of critical importance and what separates genuine Stanley Cup contenders from the rest of the pack. Teams have, over time, hunted the opportunity to displace specialists with more skill.
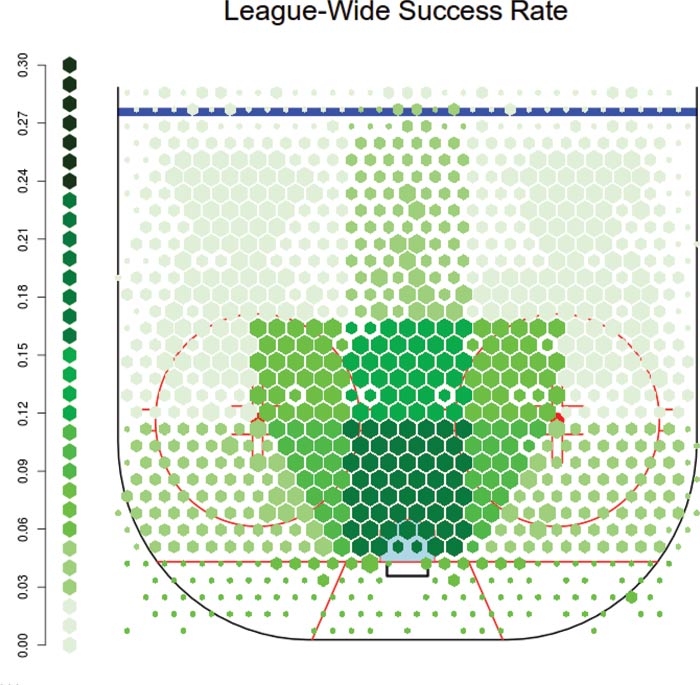
This is, of course, just one example. I would similarly point out each of these teams, save for perhaps St. Louis, play a very up-tempo brand of hockey that lends itself to generating big offensive zone shot volumes, and consequently, big offensive zone scoring chance volumes. And as teams have learned how to chase goals at the periphery – from hunting the soft parts of the defensive interior, to four-forward power-play setups – we have seen a lot more sophistication in the way teams attack.
How you weigh or apportion these factors as it pertains to the scoring increase is up to you. But I do want to focus on these elite teams, because broadly, that’s where the story is.
To show how quality has separated, let’s compare the offensive production of each team this season against their peers in prior years — that is to say, we compare this year’s No. 1 offence to the No. 1 offences in prior years, then repeat through the rest of the league. We can look at these comparisons in five- and 15-year horizons.
As you work towards the weaker offensive teams you still see offensive upside, but it is much more muted.
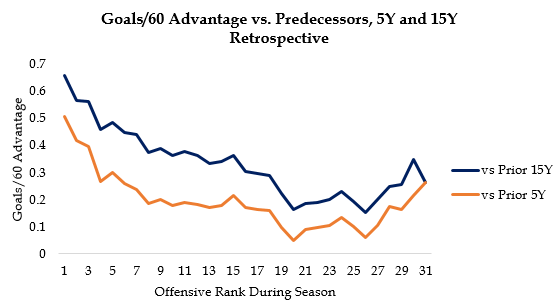
How do we make sense of this graph? Well, the league’s best scoring team this year – the Panthers – has been a staggering +0.66 goals (per 60 minutes) better than the top-ranked scoring teams of the past 15 years, and +0.50 goals (per 60 minutes) better than the top-ranked scoring teams of the past five years.
The graph’s initial steepness, followed by a flattening, indicates the league’s best teams are more proportionally driving scoring. But even at the other end of the spectrum, weak offensive teams today are still better than the weak offensive teams of yesteryear.
There is little doubt we are in the midst of an offensive renaissance right now, and the fact these teams have bucked the usual trend of every late-season game finishing 2-1 is an astonishing accomplishment in and of itself.
Now, the ultimate test: Do these teams continue to score at a blistering pace come the playoffs, or do we see a sharp drop-off as these strong offensive teams invariably run into better defensive clubs?
Data via Natural Stat Trick, Evolving Hockey, NHL.com, HockeyViz