
Jul 12, 2018
The NHL still hasn’t figured out how to pay goaltenders
So much money is being spent on a position we have such little statistical understanding of, Travis Yost writes.
By Travis Yost

Entering the 2018-19 NHL season, the three goaltenders carrying the largest cap hits are Carey Price, Henrik Lundqvist and Sergei Bobrovsky.
All three are in unique spots. Carey Price ($10.5 million cap hit) is a 30-year-old goaltender coming off of his worst professional season. Behind a leaky Montreal team, Price managed just a 90.0 save percentage in 2017-18. That ranked him 47th league-wide, trailing names like Ottawa’s Mike Condon and Vancouver’s Anders Nilsson.
Henrik Lundqvist ($8.5 million cap hit) stopped 91.5 per cent of shots – right around league average, and indiscernible from the likes of teammates Alexandar Georgiev and Ondrej Pavelec over their 29 combined appearances in 2017-18.
Sergei Bobrovsky ($7.4 million cap hit), meanwhile, put together another fantastic season for Columbus. His 92.1 per cent stop rate was one of the highest in the league and earned him some distant Vezina Trophy consideration.
Three highly paid goalies, three incredibly different situations. It’s what makes the goaltending position so materially different from any other skating group. There’s no doubt these are three of the more talented netminders in the league but if you looked strictly at their performance last year, you’d raise an eyebrow or two.
The goaltending pay issue has beleaguered NHL front offices for years. Decision makers who pay for performance for forwards and defencemen don’t see the same degree of volatility, perhaps in large part because the statistical measures we have available for those players are more reliable and indicative of a player’s talent.
For goaltenders, it’s quite a different story. There is almost no correlation between a player’s cap hit and the rate at which he stops shots.
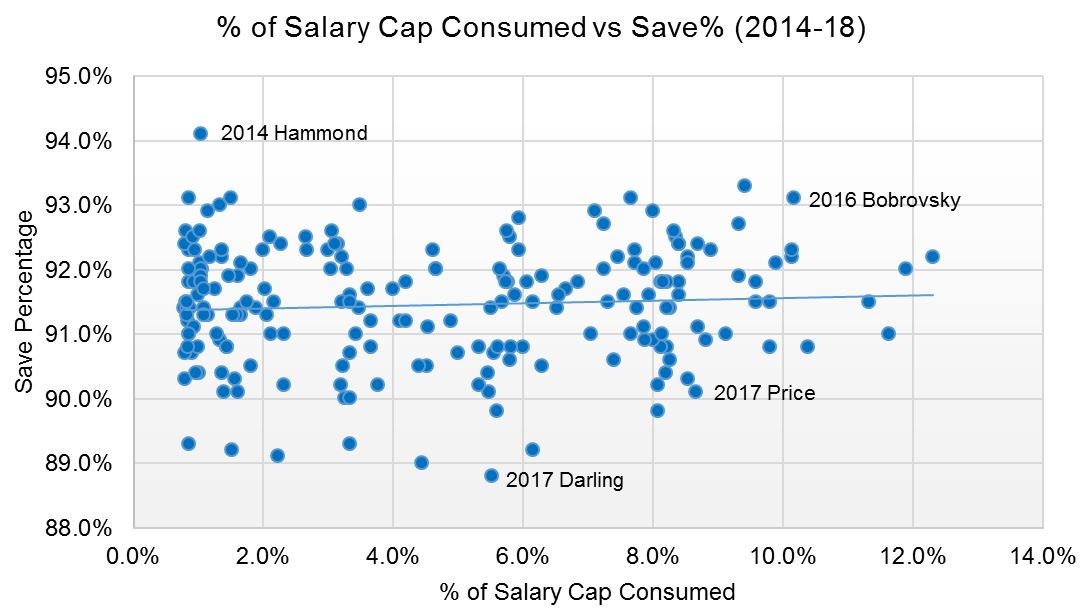
The relationship between the two is non-existent. For every fantastic season from a highly paid goalie, you have a poor season from another highly paid goalie. The same is true for the cheaper goaltenders. Another way of saying this: If you knew a player’s cap hit (or pay), you would know very little about his ability to stop shots. (Imagine substituting that with forwards and goal-scoring!)
This seems paradoxical. How can a position so critically important to the game be so unpredictable? How can so much money be spent on a position where we have such little statistical understanding?
One plausible theory is that the measurement fails because save percentage is more a team measure than an individual one. For example, consider Scott Darling – noted on the graph above. He played 75 fantastic games over three seasons with the Chicago Blackhawks and signed a lucrative deal with Carolina to take over as the de facto number one for the 2017-18 season. Darling’s performance was abysmal. His 88.8 stop rate was one of the lowest in the league. But goaltending in Carolina has been challenging for years. Is it possible that poor defensive play is adversely impacting the play of a slew of goaltenders, including – but certainly not limited to – Darling?
It’s as reasonable a question as any. But newer measures of goaltending performance should be able to provide an answer. What we are ultimately trying to solve with Darling, and any goalie for that matter, is whether or not they are positively contributing to team performance. To that end, we must consider their ability to stop shots, but we must also take into consideration the quality of the shots they face. Elite defensive teams will more frequently unburden their goaltenders by keeping shots to the perimeter, while poor defensive teams will all but open a formal invitation to their crease.
Let’s look at Delta Save Percentage (via Corsica). Delta Save Percentage measures the difference between a goalie’s actual save percentage on the year and the save percentage we would have expected that goaltender to realize based on the volume and quality of those shots. The idea is that more talented puck-stoppers will generate positive numbers here because, regardless of the difficulty of those shots, they are simply more likely to stop them.
Does the relationship change?
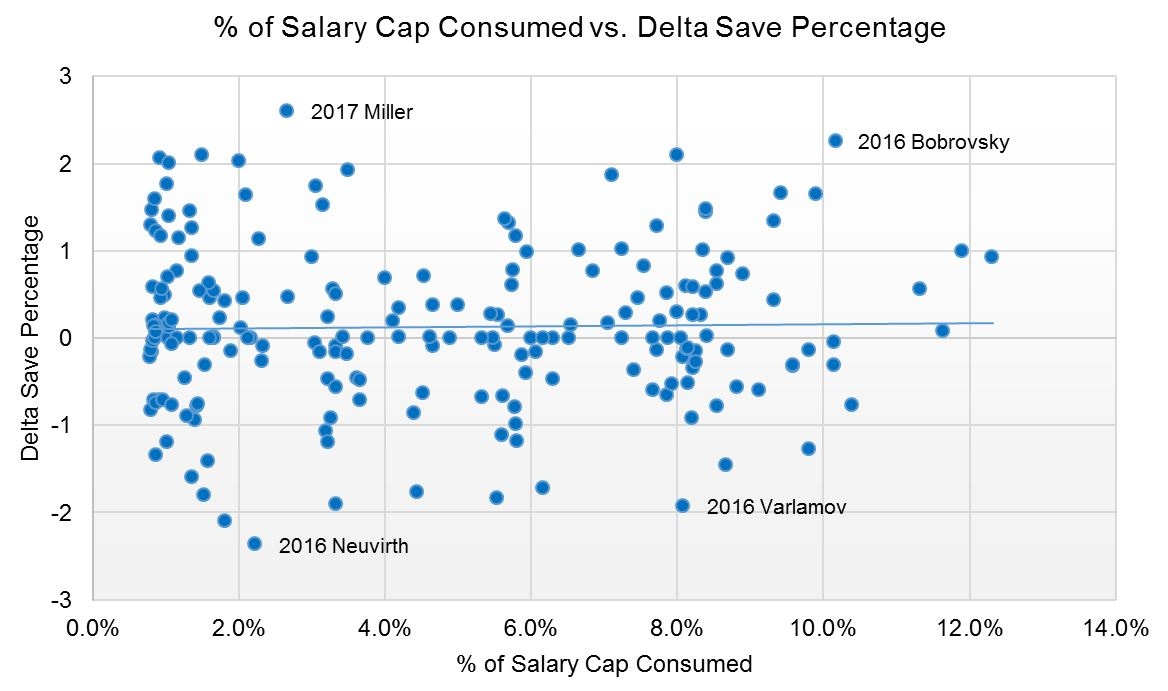
Again, there’s no relationship. When considering shot volume and shot quality, we don’t see any evidence that highly paid players are any more or less likely to stop proportionally more shots than their lower-paid compatriots. Though, I am a bit fascinated by 2017-18 Ryan Miller. He didn’t pop on anyone’s radar because of the limited games played (28 in total), but he stopped 92.8 per cent of shots in a sample where we could have most reasonably expected him to stop 90.2 per cent. That’s the highest delta observed in the last four seasons.
Now, maybe a great hockey scout or exceptional front office has figured something out that most other teams haven’t. Maybe there’s something on a player’s tape – or something in another statistical measure – that can better tease out the value a goaltender brings to the table. I’m not sure we can rule that out.
What we can rule out, though, is this notion that the league at aggregate has figured out how to pay goaltenders. The above graphs would suggest that it’s a pointless endeavour to negotiate an NHL goalie’s second or third contract, since the possibility of him being outplayed by a younger, cheaper goaltender on his first contract or a “bridge” deal is high.
The league probably does a strong job of weeding out the goalies who don’t belong. We rarely see guys with truly terrible and persistent save percentages stick around for a long time, and that makes sense. But discerning the league’s fifth best goalie from the league’s 19th best goalie? That seems like an impossible task with what we have available.
Which raises the question: Why are teams paying premiums for guesswork?