
Jan 21, 2019
The undeniable link between save percentage and the Jack Adams Award
Travis Yost argues there are two criteria for whether or not a head coach becomes a Jack Adams Award finalist: being in charge of the winningest team in a given regular season, or being in charge of the team with a substantial (and often random) increase in save percentage.
By Travis Yost

It’s that time in the NHL season when you start to hear about serious candidacies for year-end awards. By now, the contenders have separated themselves from the pretenders and voting bodies – be it media, coaches, general managers, fans, whatever – are starting to get a strong feel for who their respective finalists may be.
Award season is a bit of a funny business because criteria can be rather difficult to follow. One of the trickier awards to vote for is the Jack Adams – awarded to the NHL coach adjudged to have contributed the most to his team’s success. In recent years, it seems as though the finalists can be isolated into one of two categories: the coaches who led their team to the top of the standings or the coaches who led an over-performing team into the playoffs.
Both of those buckets make sense, but it’s a rather tall order to expect a voting contingency – the Jack Adams is voted on by the NHL Broadcasters’ Association – to be able to untangle how much of a team’s success can be tied back to a coach. The first scenario (among many other things) is contingent on a front office being able to build a talented, cap-compliant roster.
If you think that segment of coaches is a tricky one to analyze, consider the other bucket. The second scenario has much more to do with our prior assumptions and preconceptions. Why did we believe that team would struggle during our preseason analyses? What did we miss? Moreover, how much of that team’s gain in the standings can be tied back to coaching impact as opposed to a slew of other factors?
It’s for this reason that I posit there are generally only two criteria for whether or not a head coach becomes a Jack Adams Award finalist: a coach being in charge of the winningest team in a given regular season, or a coach being in charge of the team with a substantial (and often random) increase in save percentage.
Consider the table of Jack Adams winners since the 2008-09 season. Here we can look at a team by the percentages in the year their coach won the trophy versus the team’s save percentage in the prior year and future year. It is, in one word, stunning:
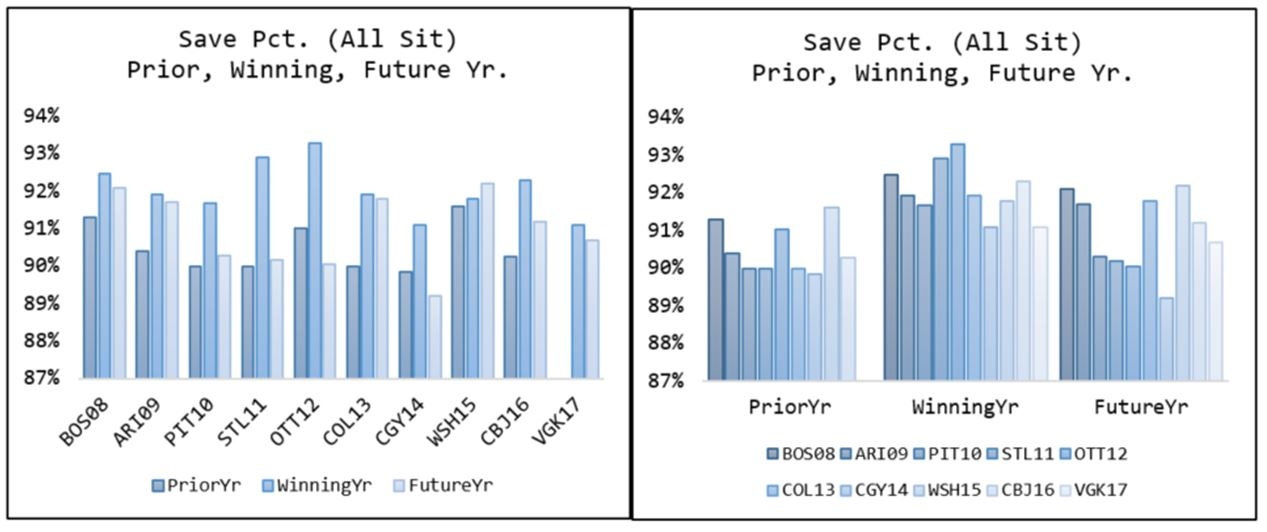
The average save percentage (all situations) has been generally stable over the last decade or so at about 91 per cent, though 2017-19 has seen slight save percentage drops relative to prior years. Over that same timeframe, the average Jack Adams Award winner saw a prior year save percentage around 90.5 per cent, a winning year save percentage around 92.2 per cent, and a future year save percentage of 90.8 per cent.
This cuts two different ways. One, it seems clear to me that we intentionally or otherwise tend to heavily shape our outlook of a team’s future probability of success on save percentage. In addition, when we see sharp upticks in save percentage over a future period, we tend to reconcile that as general team improvement that ties back to coaching impact. Yet in the following year that same save percentage – the save percentage that, by and large, earned a head coach hardware – regresses right back to league average, much closer to what it was in the prior season than what it was in the award-winning year.
It’s worth keeping in mind that I didn’t remove any Jack Adams winners from the above data set. A few of these teams were in bucket one – conference winners from the above list include Boston in 2008-09 and Washington in 2015-16, with a couple of other teams (Pittsburgh 2010-11, St. Louis in 2011-12) missing by just a point or two.
Another important distinction is you really can tie this back to just goaltending performance. It would make intuitive sense that the percentages – the things that descriptively drive goal differential – correlate well with a team’s win-loss record. But shooting percentage, which is just the offensive version of this same discussion, doesn’t have nearly the same relationship:
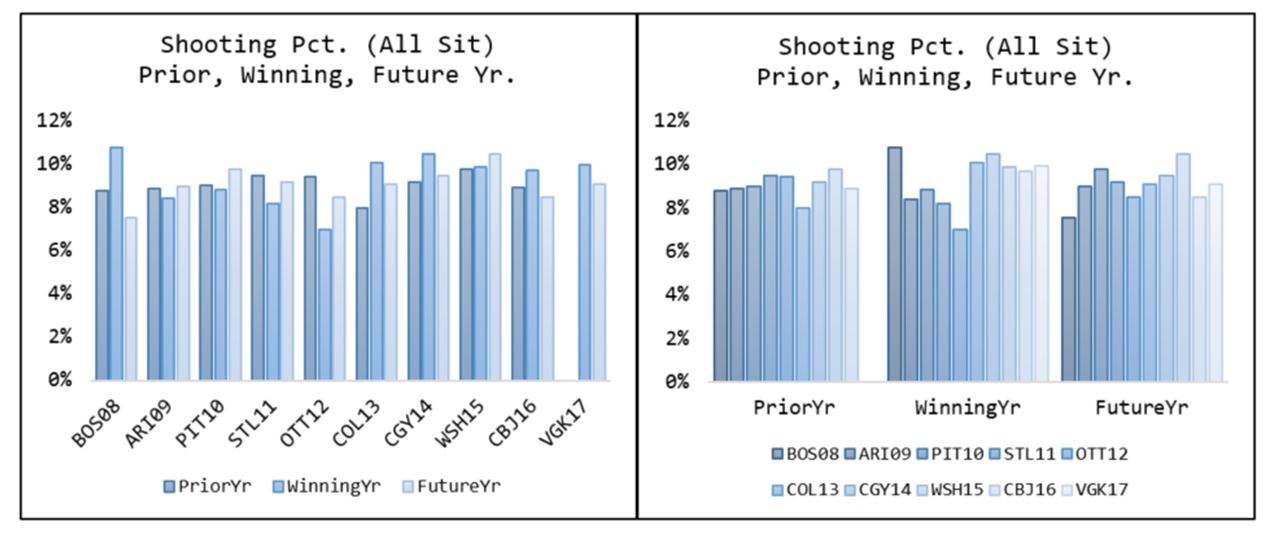
It is almost perfectly flat. Again, same rundown as above: the prior year shooting percentage is around 9.1 per cent, the winning year around 9.3 per cent, and the future year around 9.1 per cent, where the league average sits right around 9.0 per cent.
So what does this mean for the Jack Adams Award in 2018-19 and beyond? Is it as predictable as taking the coach of the league’s winningest team and appending two coaches of teams with suspiciously high save percentages and calling it a day? It certainly seems that way, which means you can already pencil in two coaches for as Jack Adams finalists right now: Tampa Bay’s Jon Cooper, and New York’s Barry Trotz. Give it another 10-15 games and you can probably predict all three finalists with laser accuracy.
I sympathize with voters on this. It’s difficult to understand true coaching impact for a multitude of reasons, but simply taking the best team and the team with a rocketing save percentage doesn’t seem right. I suspect it is one of the reasons why, ironically, a stunning majority of Jack Adams winners are fired rather shortly after their winning season. We are basing their positive impact on something that is largely out of their control, and when it dissipates, perception is that they have lost something.
At any rate, it’s something to consider when the ballots come in a few months.