
Mar 12, 2020
Trying to make sense of a potential 70-game NHL season
What does a 70-game National Hockey League season mean? It’s really the only question I could bring attention to considering everything else going on, especially since it feels like we are mere hours away from the suspension of the season, Travis Yost writes.
By Travis Yost

What does a 70-game National Hockey League season mean?
It’s really the only question I could bring attention to considering everything else going on, especially since it feels like we are mere hours away from the suspension of the season. The NHL, like every major industry, is grappling with the reality that their business is heading for a rapid and immediate change because of the coronavirus, and the uncertainty around the next few months is omnipresent.
It did give me some time to think about how to wrap up the 2019-20 regular season if this truly is the end point (the regular season may return at a later date; the league may also decide to flip this right to the postseason when everything calms).
We have a clear-cut Presidents’ Trophy winner in the Boston Bruins, and at least two presumptive divisional winners in the Washington Capitals and Vegas Golden Knights. On points pace, we would probably award the Central Division to the St. Louis Blues (1.32 per-game) over the Colorado Avalanche (1.31 per-game).
But what about those compelling playoff races further down the standings? I’m reminded of a post written by Phil Birnbaum years ago, where he estimated it took a whopping 73 regular-season games for talent to overwhelm luck in the standings. Birnbaum attributed this to, among other things, the incentive for teams to generally play into those three-point games that seem to tie the standings up in knots.
We are about a week or so away from that 73-game mark, and so we would expect that standings placement – if this is the end – is an accurate reflection of what we have seen from a team talent perspective. There are a number of ways to model this out, but I prefer PythagenPuck, which can calculate win probabilities based on goal differentials and extrapolate that out to expected standings points.
If we take a goal differential-driven approach to win probability and measure it against actual standings points we can see which teams may have overperformed or underperformed their position in the standings and what that may have meant to the stretch run heading into April.
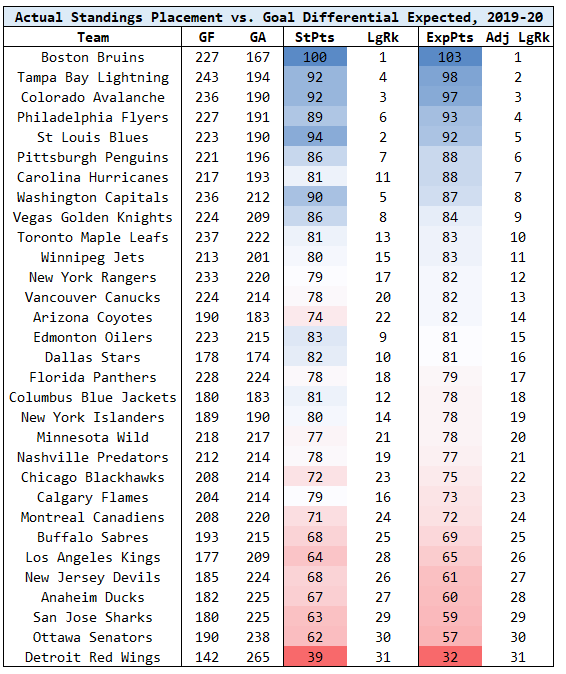
Most of the standings look the same, but there are a few outliers on both ends of the spectrum. Look at the Arizona Coyotes and Carolina Hurricanes, two teams that are in the middle of a playoff dogfight. If you look at the respective goal differentials of each club, we would assess them to be about eight and seven points on the unlucky side, respectively. Those points are lost, regardless of what happens going forward, but it lends credence to the idea that these teams – assuming all other variables held equal – would be likely to take a higher proportion of expected points in the final month of the season based on how they played to date.
On the other side of that coin you have the Calgary Flames. Calgary has 79 standings points and a 63 per cent chance of making the playoffs – in other words, the team is in a fairly decent spot to reach the playoffs with either the third slot in the Pacific Division or one of the two wild-card berths. But Calgary has carried a -10 goal differential through the regular season; compare that to teams they are fighting with in Arizona (+7), Minnesota (+1), Nashville (-2), Winnipeg (+12), and Vancouver (+10). All of those teams have considerably better numbers over the course of the season, but the daylight in the standings between them and a club like Calgary is non-existent.
In short: I don’t think a truncated regular season prevents us from understanding who the best team has been this season (clearly Boston), but those remaining 10-12 games would have been critical in separating a number of teams at the playoff cutline.
It’s a shame we will likely miss a compelling race to the finish, but right now there are simply bigger issues to tackle.
Data via Hockey Reference and HockeyAnalytics