

Oct 30, 2014
Yost: Rest makes a major difference in NHL performance
The people responsible for creating the thirty NHL team schedules have to take into account things like venue availability, travel burden, associated costs of travel, and competitive balance, all while trying to squeeze 1,230 games into a seven-month window. Travis Yost digs in to reveal how much rest matters to a team's likelihood of winning.
By Travis Yost

The National Hockey League’s scheduling process strikes me as a laborious task. The people responsible for creating the thirty team schedules have to take into account things like venue availability, travel burden, associated costs of travel, and competitive balance, all while trying to squeeze 1,230 games into a seven-month window.
One of the things I’ve always found most interesting is how the league attempts to mitigate the number of back-to-back situations (not so eloquently referred to as “schedule losses” in NHL and NBA circles), a considerable slice of the league’s larger fight with competitive balance. To the league’s credit, Dirk Hoag’s work suggests that the league does try to schedule a comparable number of back-to-back situations for every franchise.
Now, the eyeball test has long been damning of team performance on the second-half of back-to-backs, and I think that’s largely why the league has really made a concerted effort to balance the number of schedule losses around the league. The data substantiates what the eyeball test has told us for so long – teams on no rest struggle considerably relative to league norms, considerably so when those back-to-backs come on the road.
Seven years of available data substantiates what the eyeball test has told us for so long – teams on no rest struggle considerably relative to league norms. Below, I have compiled Score-Adjusted Fenwick%, 5-on-5 Goal%, and Regulation/OT Win% for teams in back-to-back situations. They are slotted next to your league-average rates, to illustrate the drop-off between the two.
(Score-Adjusted Fenwick% is a measure of 5-on-5 unblocked shot attempts, weighted for score, comparing results to league averages based on game score.)
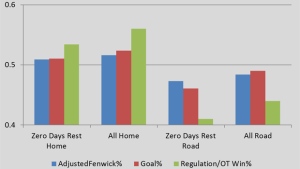
The Value of Rest
| Score-Adjusted Fenwick% | Goal% | Regulation/OT Win% | |
|---|---|---|---|
| Back-to-Back Home | 51.0% | 51.0% | 53.0% |
| All Home | 52.0% | 52.0% | 56.0% |
| Back-to-Back Road | 47.0% | 46.0% | 41.0% |
| All Road | 48.0% | 49.0% | 44.0% |
So, teams without rest against teams with rest of ranging length are going to underperform – we see a three percentage drop-off in regulation/overtime win percentage for both home and road teams, which really is the smoking gun. It’s also hard to miss that possession and goal metrics slide in both states, too. Home teams drop a full percentage point on both fronts. Road teams drop a percentage point in possession rates, and three percentage points in goal rates.
But, back-to-back situations – or “schedule losses” -- aren’t the only instance where a team is disadvantaged. The theory isn’t just that teams devoid of rest are at a disadvantage. It’s that teams disproportionately rested to the opposition are at a disadvantage, in which back-to-back situations are only a small part of a large sample.
Let’s change gears and turn to rest differentials. We can pull data for how teams perform with three days favorable rest, two days favorable rest, one day favorable rest, and so forth. If our theory holds true, performance – be it by possession rates, goal rates, or win rates – should deteriorate as rest becomes less advantageous, and travel becomes more frequent.
Over the same seven years of data, here’s how home teams performed over various rest differentials.
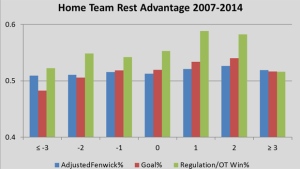
Home Team Rest Advantage 2007-2014
| Rest Advantage | Score-Adjusted Fenwick% | Goal% | Regulation/OT Win% |
|---|---|---|---|
| 3 or more day deficit | 50.9% | 48.3% | 52.3% |
| 2-day deficit | 51.1% | 50.6% | 54.9% |
| 1-day deficit | 51.6% | 51.9% | 54.2% |
| Even | 51.3% | 52.0% | 55.3% |
| One-day advantage | 52.1% | 53.4% | 58.9% |
| Two-day advantage | 52.6% | 54.0% | 58.3% |
| 3 or more day advantage | 51.9% | 51.7% | 51.6% |
I think this graph is about as telling as it gets. As you increase a home team’s rest advantage, their possession rates, goal rates, and win rates all spike. The inverse, of course, is true for road teams – as they see rest become more unfavourable, possession rates decline, goal rates decline, and win rates decline.
Again, this gets very much back to what our eyes tell us – that teams who have rest advantages generally play a better hockey game, and teams that are fatigued generally play a worse hockey game. More importantly, it signifies that not all games are created equal. A home team with a two-game rest disadvantage is only expected to control 51.09% of the play, 50.58% of the 5-on-5 goals, and win 54.87% of the games. A home team with a two-game rest advantage should be held to significantly higher standards: on average, they should control 52.64% of play, score 54.04% of the goals, and win 58.25% of the hockey games.
It seems certain to me that the league would be privy to this sort of data and reluctant to put teams into positions where they are regularly at a rest disadvantage, but it’s still an important topic that should be considered when forecasting future outcomes. Rightfully, analysts spend a lot of time talking up the importance of home-ice advantage – the data bears this advantage out. However, this data suggests that rest is another critical, albeit less appreciated, factor for teams and associated performance.