
May 30, 2019
Defence the story so far in Stanley Cup final
Defensive pressure kept meaningful offence to a minimum as the Bruins and Blues exchanged wins in the first two games of the series, Travis Yost writes.
By Travis Yost

On Monday I wrote that I expected the 2019 Stanley Cup final to be a defensive-minded, low-scoring affair.
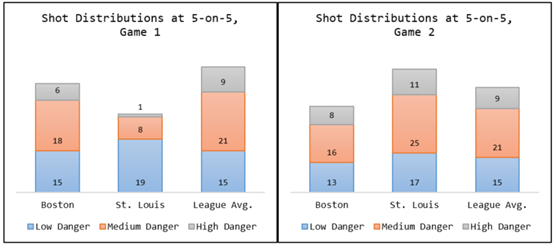
The opening pair of games in Boston only served to solidify that line of thinking. Game 1 featured six goals, just a tick under the league average during the 2018-19 season. But there’s plenty of nuance there. First, one of those six goals was the empty-netter by Brad Marchand late in the third period. Second, and perhaps more importantly, an extensive amount of game was played along the perimeter and in the neutral zone. More than anything, the Blues and Bruins managed to capitalize on the small number of opportunities they had.
Game 2 – a five-goal overtime affair – wasn’t much different. That was especially true at 5-on-5, where the two teams have already played about 100 minutes of hockey.
In Game 1, it was St. Louis that couldn’t generate much of anything in the Boston offensive zone. The Blues carried just 28 shot attempts in total, and their offence certainly faded in productivity as the game progressed. In Game 2, the roles merely flipped. In the 50 5-on-5 minutes in Game 2, the Bruins managed just 37 shot attempts and collapsed as the game wore on. (The Bruins managed just one high-danger shot attempt at 5-on-5 in the third period and overtime combined.)
Looking at the distribution of shots, two things become obvious. The first: both teams are having real difficulty piercing the interior of the opposition’s defence and generating those low slot and high slot opportunities. The second: both teams are having a difficult time generating a lot of offensive volume. The defences are doing a fantastic job of bottling puck carriers up in the neutral zone and at the blueline. When the offensive zone is gained, the defences are mostly limiting it to one-and-done attacking sequences.
To show this, I have built up all shot attempts taken during the first two games, along with a heat map of the shot spread provided by Natural Stat Trick
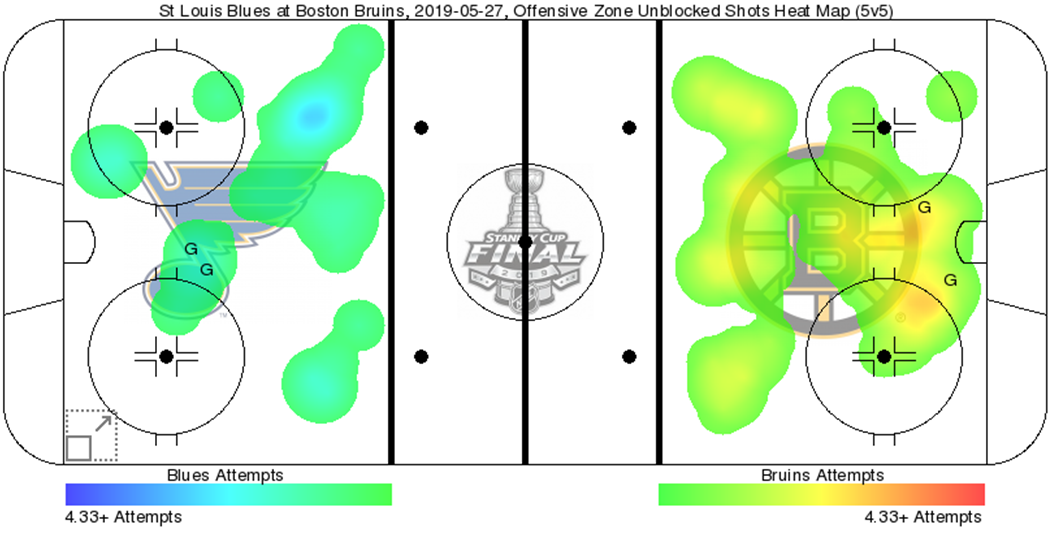
Game 1 was incredibly low event at 5-on-5. If Boston had trouble getting into the interior of the St. Louis defence – well, you needed a much stronger adjective for how much difficulty the Blues had going the other way. Over the course of 45 minutes of 5-on-5 hockey, the Blues were credited with just nine shots from reasonably dangerous areas of the ice.
Three shots stand out in particular – Oskar Sundqvist’s rush attempt, Brayden Schenn’s first-period goal and Vladimir Tarasenko’s second-period goal. They all had one thing in common: they came from between the circles, where shooting percentages substantially increase. (Actual goals in the game were 2-2 at 5-on-5; our expected goal calculations had it 1.7 to 0.6 in favour of Boston.)
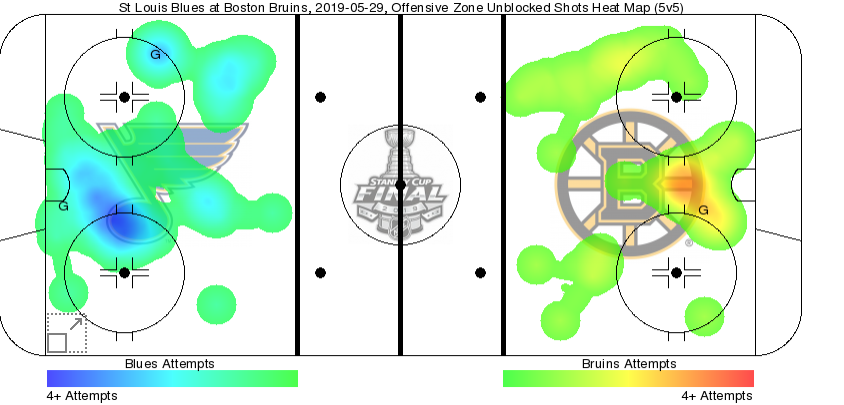
The Blues did a much better job in Game 2 – the frequency with which they generated shot traffic from in and around Tuukka Rask’s net was night and day from what we saw on Monday night. It was the Bruins who were offensively challenged.
One notable takeaway for me was how well St. Louis did in taking two key Boston lines out of the game. The Patrice Bergeron line managed just four shot attempts at 5-on-5 in Game 2, none of them considered dangerous. The Sean Kuraly line managed just six shot attempts in nearly 11 minutes, though they did log the one Boston 5-on-5 goal by way of Joakim Nordstrom’s backhand right outside of the Boston crease.
Both teams have proven capable of applying pressure on one another offensively, but the theme of the first two games is that the losing team was generally overwhelmed by defensive pressure and struggled tremendously to generate meaningful offence.
I anticipate we are going to see this trend continue in what is looking like a series that may go the distance.
Data via Natural Stat Trick