
Sep 3, 2015
How analytics forecast future success and failure
TSN’s Travis Yost explains why the 2011-12 Los Angeles Kings and the 2012-13 Toronto Maple Leafs are the most prominent examples of how hockey analytics predict future performance
By Travis Yost

One of the big reasons hockey analytics have really exploded in recent years is their ability to forecast mean reversion well in advance of the rest of the industry.
The two most prominent examples of that were the 2011-12 Los Angeles Kings and the 2012-13 Toronto Maple Leafs. That Kings team was marked as a sleeping giant by many who were paying attention to their underlying numbers, arguing that their middling performance in the standings wasn’t quite indicative of their true team talent. On the other side, you had the 2012-13 Maple Leafs – a team marked as unfathomably lucky and bound for long-term failure.
Simple understanding of what is and isn’t repeatable talent can go a long way in forecasting future success/failure, and it’s one of the big reasons why so much attention is paid to stats like Corsi%. Controlling possession at even-strength correlates well with winning long-term and, most importantly, is a repeatable skill. Scoring on a high percentage of shots also correlates well with winning, but it’s prone to major fluctuations and exhibits very little repeatability over long samples.
Alternatively: a team with great Corsi% can bank on having a great Corsi% in a follow-up year. A team with, say, a great shooting percentage can’t bank on having that same shooting percentage in a subsequent year. This is simply difference between repeatable skill and random variance.
Even if you don’t believe basic repeatability tests, you can always fact check what’s happened historically. For example, let’s look at a bunch of the teams cut from that 2012-13 Toronto Maple Leafs cloth – the teams with historically weak Corsi% who wound up racking up a bunch of points in the standings in the same year. How did they fare in the following year? Were they able to preserve their winning ways by way of sky-high shooting and save percentages, or did their inability to win the even-strength possession battles come back to haunt them?
It’s easy to check on that. I’ve pulled all teams from the 2007-2008 season onward (excluding the lockout-shortened season) who would qualify as ‘Low Corsi%/High Point’ teams (< 48% Corsi; > 91 points). I’ve then included their point totals in the subsequent year.
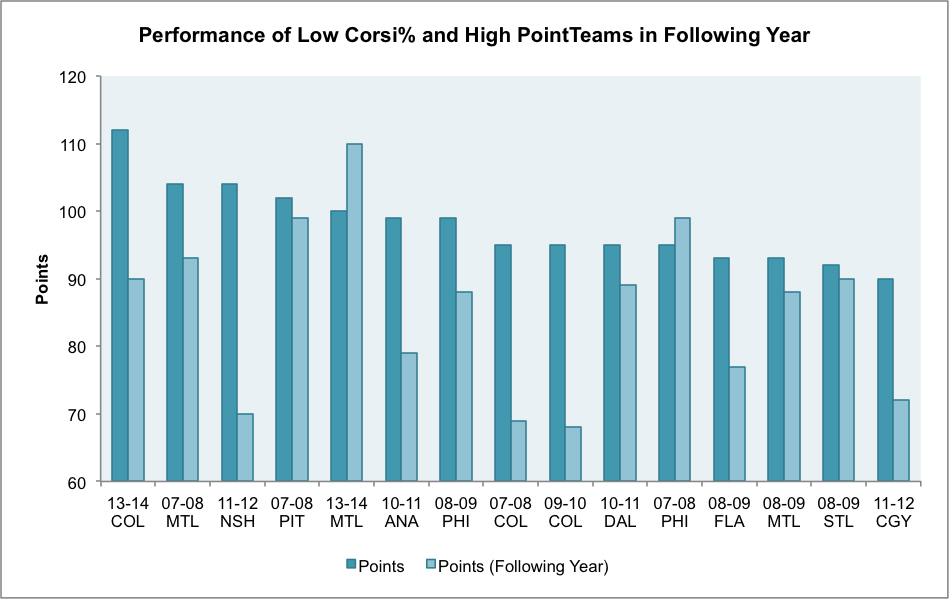
Many moons ago, there would be exhaustive back-and-forth arguments about whether or not a certain team could be the special butterfly that could repeat or improve upon their fairy-tale season. Now you have a 15-team sample that you can easily point to and say, “See? It’s really, really difficult.”
Here’s the raw math: 87 per cent of our “Low Corsi%/High Point%” teams saw their point totals drop in the following season. The average variance for one of these teams is a drop of 12.5 points. For basically every team, that kind of change can mean the difference between a playoff berth and a chance at the draft lottery.
You may be wondering if these teams saw their possession numbers move in any meaningful direction, one that would have impacted their performance beyond expected regression. Quick answer: no. The average team moved just 0.37 per cent from one year to the next. Not surprisingly, the two teams who did see a climb in their point totals – the 2013-14 Montreal Canadiens and 2007-08 Philadelphia Flyers – did see improvement in their possession numbers.
If you’re curious to whether or not this should put any team on notice from last year, the answer is yes. The 2014-2015 Calgary Flames amassed 97-points despite a 44.4 per cent Corsi%. If they regress anywhere near the average variance (-12.5 points), they’re in major jeopardy of missing the post-season.
Just to show you that the reverse works in the same manner, I’ve compiled the list of teams with ‘High Corsi%/Low Point’ teams. It’s a much smaller list historically, since it’s pretty difficult to dominate even-strength and miss the playoffs in a format where basically half of the teams earn a berth. Either way, five teams have posted a 52 per cent or greater Corsi% with 91-points or less in a given season. How did they look in the following year?
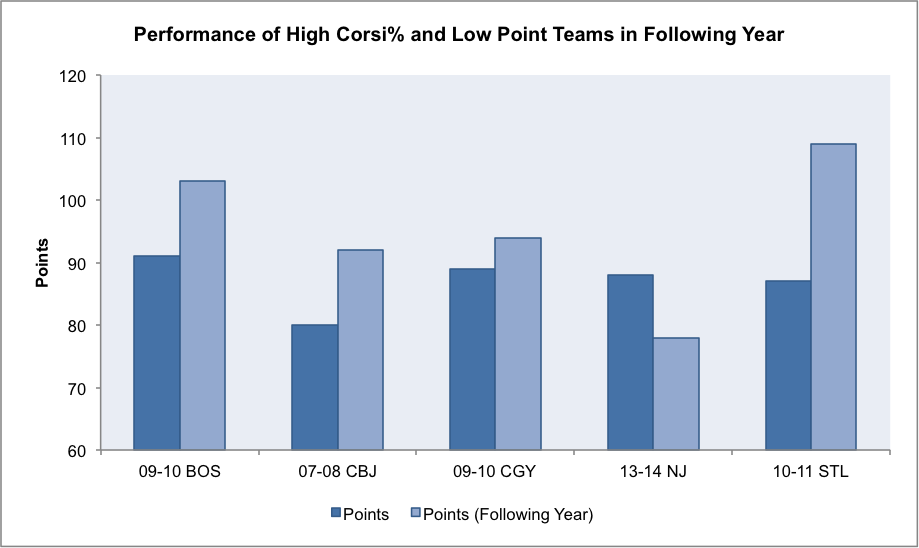
Four of the five ‘High Corsi%/Low Point’ teams went on to have stronger follow-up seasons. The average point improvement for these five teams is about 8.2 points in the standings, or four more wins. It’s a significant amount.
The one weird team would be last year’s New Jersey Devils, who took a major step backward. But, much like the two teams in our previous example who saw their points improve by way of their possession improving, the reverse is true here. The Devils dropped from 54.1 per cent to 46.8 per cent – one of the single biggest drops in recent history. It was both unexpected and, obviously, not the norm.
The Takeaway
Corsi% is a repeatable team skill, one that correlates well with success over long periods of time. Teams that find brief success despite poor Corsi% generally cannot sustain their winning ways over long stretches. Teams burned by poor puck luck in the standings despite great Corsi% generally see things normalize, moving up the standings in quick fashion.