
Jul 18, 2019
Is Talbot primed for a bounce-back season in Calgary?
On July 1, journeyman goaltender Cam Talbot signed a one-year, $2.7 million contract with the Calgary Flames. And it may just end up being one of the better bargain buys of the summer, Travis Yost writes.
By Travis Yost

On July 1, journeyman goaltender Cam Talbot signed a one-year, $2.7 million contract with the Calgary Flames. And it may just end up being one of the better bargain buys of the summer.
Talbot, now with his fourth team since entering the league in 2013-14, has had a fascinating career arc. After two impressive opening seasons in New York, Talbot was traded to Edmonton for three draft picks in the summer of 2015. At the time, Talbot was victimized by a numbers game that started and ended with Henrik Lundqvist.
In Edmonton, we saw mixed results. The 2015-17 stretch saw Talbot restore order to the goaltending position, and I think it’s fair to say that he was as instrumental as any player not named Connor McDavid in ending the Oilers' playoff drought. However, like most of the Edmonton roster, Talbot’s performance slipped over the last couple of years. And at a low point, he was moved to the Philadelphia Flyers for goaltender Anthony Stolarz.
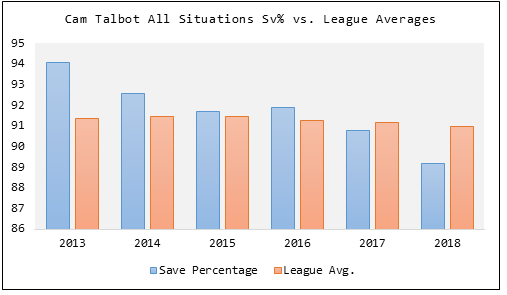
If you look at Talbot’s save percentages over the years relative to where the rest of the league has been – well, it’s mystifying. In his early years, Talbot looked like a likely long-term starter at the NHL level. More recently, his numbers have cratered so emphatically that it was increasingly difficult to believe he could land a back-up goaltending job at the NHL level.
Front offices are frequently biased by recent performance. In some cases that’s beneficial, particularly if something occurred (e.g. a lingering bodily injury, signs of aging, et al.) that would substantiate a change in production. In other cases, it’s counterproductive. The NHL is extremely susceptible to being fooled by randomness, in large part because hockey is a highly volatile, low-event game that doesn’t lend itself well to highly accurate player evaluations and future forecasts.
Even the measures we do have available to us can frequently be misleading. Take save percentage as an example here. Save percentage does well to tell us how frequently a goaltender can stop a shot, and there is some repeatability in this measure but no one believes that save percentage isn’t polluted– perhaps significantly so -- by team performance. Every year we see goalies adversely impacted by poor defensive play up front. We also see examples of goaltenders benefiting from play up front.
One of the real in-roads hockey analytics have made over the years relates to expected goals. Expected goals capture two components: shot quantity, and shot quality. Shot quality is the much more complex version of the two. Think of shot quality as applying a percentage or likelihood of any given shot finding the back of the net. How would we do that? We would look at historical distributions of goal expectancies based on the distance of the shot, type of the shot, angle of the shot, the individual shooter, and so forth.
Since expected goals are quite predictive, we can use it as a signal of sorts to determine if goaltenders are being victimized – or assisted – by the play of the rest of the team. In the case of Talbot, that’s particularly important. Because as Talbot’s save percentage cratered, so too did his expected save percentage. And while it doesn’t take the sting out of last year’s bad season, it does add some important context (Data via Evolving Hockey and Natural Stat Trick).
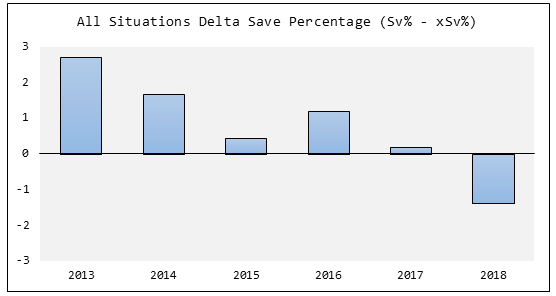
We would have expected a goaltender in replacement of Talbot last season to stop about 90.4 per cent of shots. That’s still well above his 89.2 save percentage last year, but it’s also below the league average save percentage (91.0 per cent) over the same time frame. Perhaps more noteworthy is it shows him as a value added presence during the 2017-18 season – despite trailing the average league save percentage, he still stopped more shots than we would have expected a replacement goaltender to do behind Edmonton’s defence that year.
And, more broadly speaking, we have a six-year span where Talbot has only been negative once. Since entering the league, Talbot has saved his team about 0.2 goals for every 60 minutes of hockey played. How does that compare against other regular goalies over the same window? Quite well:
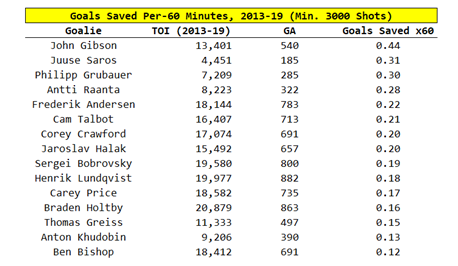
Perhaps it is possible that last year is the season that’s predictive of Talbot’s future, and that for some reason – explainable or otherwise – his game has completely eroded. But the power of large numbers is that we don’t have to be fooled by wild deviations in small samples. From 2013-18, Talbot was a very strong goaltender. From 2018-19, he was not. Put those six years against the data of those around him, and he compares well to most starters around the league. (By the by, six years of data is one of the reasons I think a betting man would see Talbot outperform his replacement in Edmonton on a going forward basis.)
And on a one-year, $2.7-million contract? Well, I’m making that bet every single time.