
Nov 14, 2019
What’s wrong with the Leafs, Lightning and Golden Knights?
Travis Yost looks at the numbers that explain the early struggles of three teams that entered the season with serious Stanley Cup aspirations.
By Travis Yost

If you created a hierarchy of Stanley Cup contenders this past summer, it’s likely that the Tampa Bay Lightning, Toronto Maple Leafs and Vegas Golden Knights would have been near the top of your list.
Some may have had these three teams, in no particular order, as the most likely 2019-20 Stanley Cup winners. Some may have had these three teams in the top five or six. But there is no doubt that each team came into the season with serious championship expectations – so serious that these three teams topped the Stanley Cup betting futures, followed by the Boston Bruins and Colorado Avalanche.
We are about 20 games into the regular season and to say these teams have not impressed would be an emphatic understatement. Consider just the standings through Thursday:
- Tampa Bay Lightning: 8-5-2 (98-point pace), 13th in NHL, +2 goal differential
- Toronto Maple Leafs: 9-7-4 (90-point pace), 19th in NHL, +1 goal differential
- Vegas Golden Knights: 9-8-3 (86-point pace), 23rd in NHL, -2 goal differential
It may just be 20 per cent or so of the regular season, but these are harrowing starts for teams with serious May and June hockey aspirations.
So what’s going on? Let’s work through each team, starting with the Bolts.
First, some critical performance indicator references for each teams across all pertinent game states:
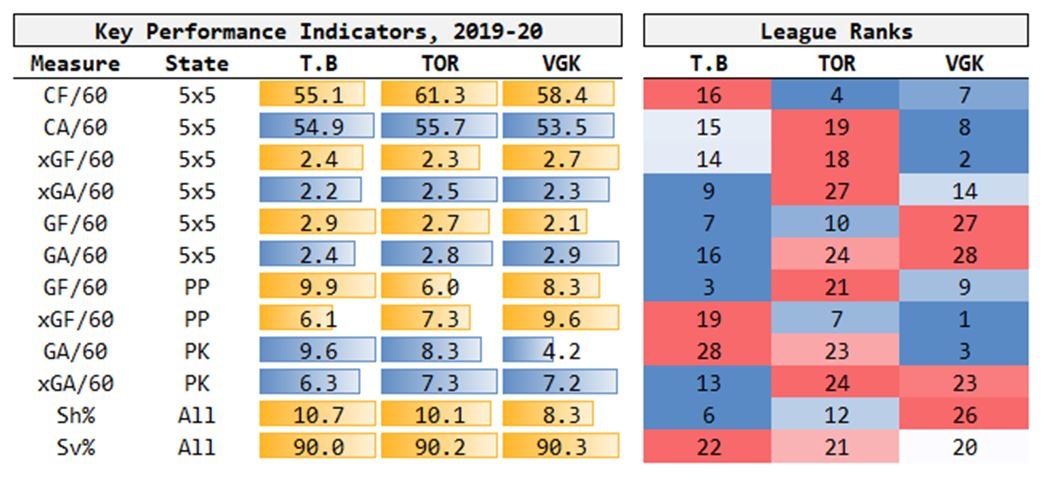
Tampa Bay Lightning
This Tampa Bay team finished last season with 128 points. That surge in the standings was predicated by an otherworldly per-game goal differential – they were 1.3 goals better than their opponent on a nightly basis last season – and a lot of it had to do with a lethal mix of playmaking prowess and sustained offensive zone pressure.
But this is a stunningly mediocre team at 5-on-5, which is a problem when you consider that about 75 per cent of games are played in that state. They are barely outshooting their opponents, their expected goal advantages (shots adjusted for quality) are marginal, and even their 5-on-5 goal differential – which is heavily percentage driven – is good for just ninth best across the league.
Steven Stamkos, in particular, has had a very curious season. Despite being Tampa Bay’s leader in the scoring race (five goals, 10 assists in 15 games), Tampa Bay is getting unflattering results with him on the ice.
Stamkos has played predominantly with Nikita Kucherov (the third forward has varied all year), and to say their production has slowed would minimize the severity of the drop-off. Consider just the production Tampa Bay had at 5-on-5 with these two on the ice last year versus this year.
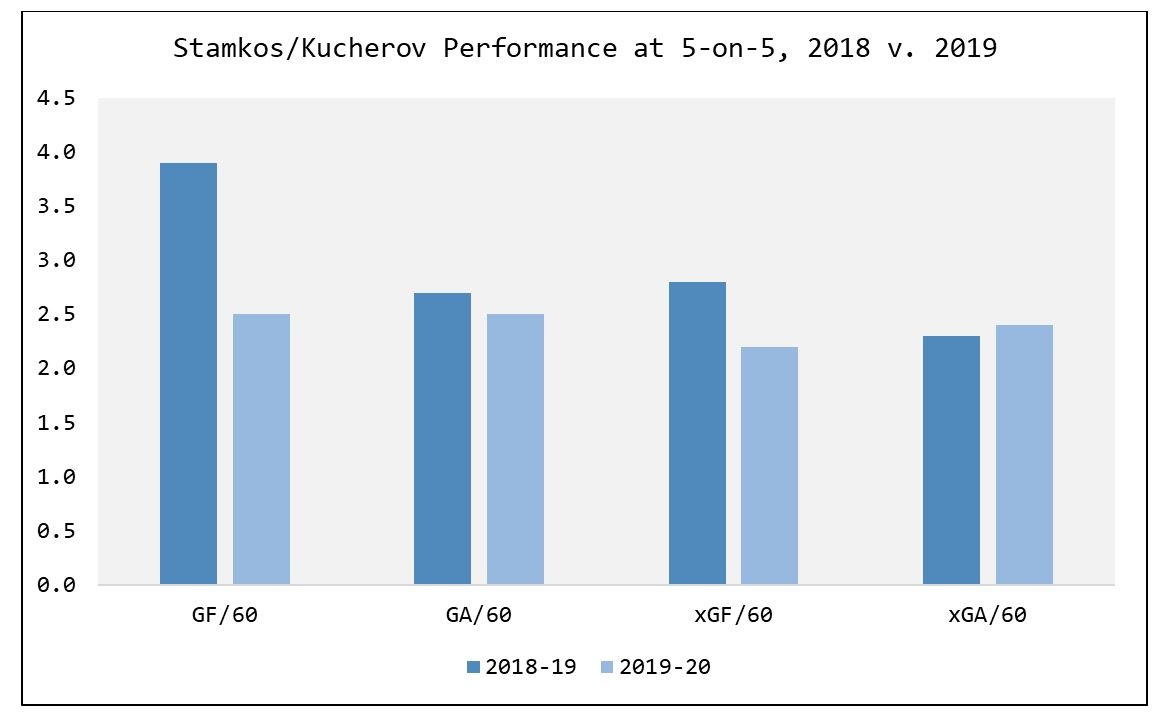
Through Tampa’s first 15 games, the Stamkos and Kucherov minutes – which used to be an absolute bulldozing of the opposition – have been a complete and utter wash for head coach Jon Cooper. That’s not to say they are playing bad hockey, but if your best unit is delivering average results, it’s going to manifest itself in the standings.
One other note on Tampa Bay: they aren’t getting nearly the same calibre of goaltending from Andrei Vasilevskiy and Curtis McElhinney this season. Both are carrying middling save percentages – .905 and .906, respectively – and are carrying negative goals saved above expectation rates. We have an awful lot of confidence in Vasilevskiy considering his track record, and it remains a safe assumption that this is more of a blip than anything else.
Toronto Maple Leafs
Stop me if you have heard this one before, but Toronto’s defensive performance remains appalling for an otherwise legitimate Stanley Cup contender. The differentiator this season – not dissimilar to what we are seeing with Tampa Bay – is that the Maple Leafs’ goaltending has not been able to erase all of the mistakes up front.
But we had little confidence in this roster being able to provide better defensive numbers than last year. Toronto’s blueline and forward groups alike struggled with their off-puck responsibilities and structural discipline last year, and their decision to retain all of their impact forwards limited what they could do to shore up areas of obvious weakness, like the blueline. Cody Ceci was a known commodity and Tyson Barrie, unfortunately, has been abysmal in the opening month with Toronto.
The real story, year-over-year, has little to do with the defence, though. The offence – that blitzkrieg attack rivalled only by the likes of Tampa Bay last year – has completely fallen apart.
The loss of John Tavares certainly impeded the lineup, but considering the personnel available to them, the Maple Leafs probably should have an offence with more bite than the Ottawa Senators. (Yes, Ottawa has scored more 5-on-5 goals this year per 60 minutes of play. So have eight other teams.)
The story is right here, beautifully visualized by our friends at HockeyViz. This team simply can’t get to the front of the net, and continues to let their defensive skaters generate feeble offence from the blueline:
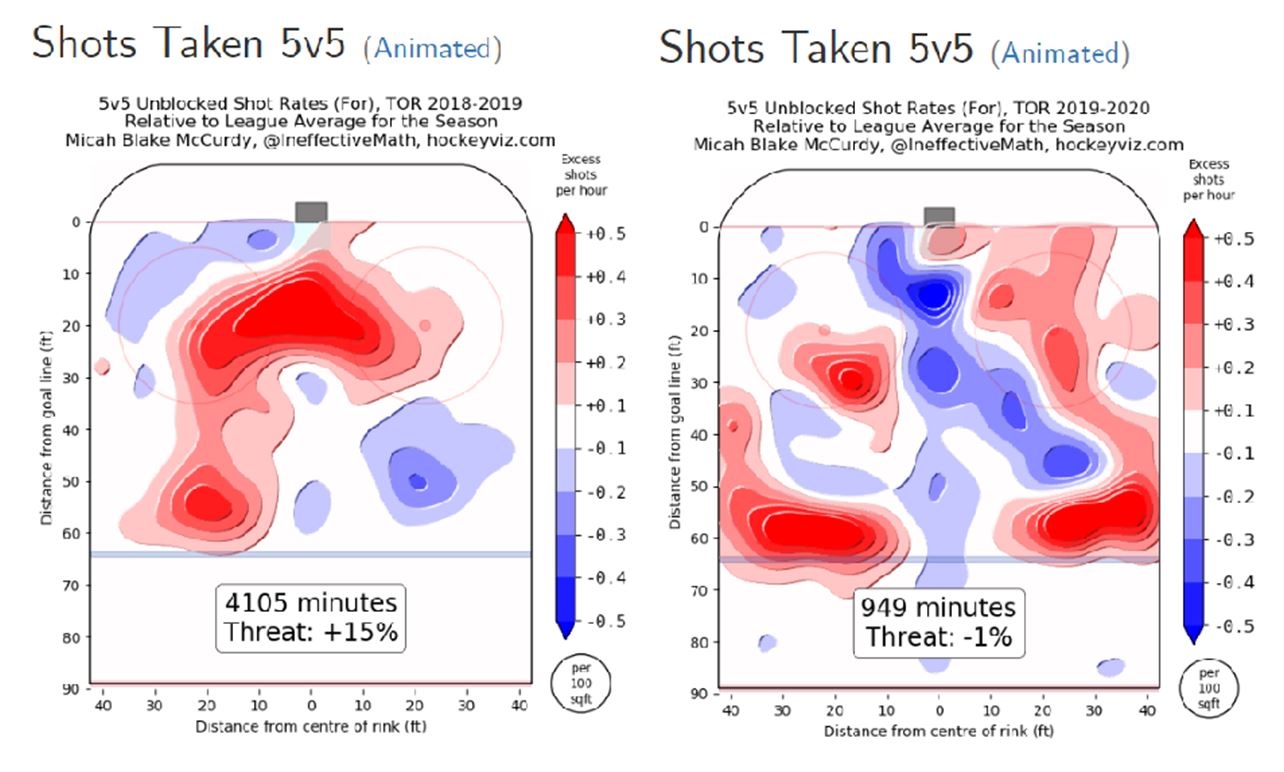
Most of Toronto’s skaters are down year-over-year in terms of scoring chances or goals generated per 60 minutes at 5-on-5, but the most notable has to be that of the recently injured Mitch Marner (primarily playing with Tavares before his hand injury).
Through Thursday, the Maple Leafs are generating 1.7 goals per 60 minutes and 2.1 expected goals per 60 minutes with him on the ice. Amongst qualified skaters, that’s in the 22nd and 36th percentile respectively. It’s simply not good enough.
Vegas Golden Knights
The concerning thing about the Golden Knights’ start is they haven’t been able to stay as much afloat in the standings as the Lightning and Maple Leafs have despite their respective struggles. The reality of the weaker Pacific Division is that it probably won’t take a Herculean effort to erase that start, but the Golden Knights certainly have some work to do.
What is working in Vegas’ favour? Most of their issues lie within fleeting shooting and save percentages that tend to be much more volatile than things like shot rates, scoring chance rates, and the like. They are also much more susceptible to regression, which in the case of Vegas – a team that remains one of the more territorially dominant units in the league -- would probably drive a surge in the standings.
For every 60 minutes of play at 5-on-5, this team is five shots (seventh) and 0.4 expected goals (fourth) better than their competition. In time, that will drive a more favourable goal differential. And, as you can see in the data table above, this team’s power play and penalty kill are core strengths of the team so far.
So where is the risk area with a team that seems to just need a month or two more of hockey to see their results normalize? It’s in the net. The Golden Knights are deathly reluctant to use backup goaltenders – Malcolm Subban is the only netminder the organization appears to trust behind Marc-Andre Fleury, and he has an .899 save percentage (as a career .903 goalie) to start the year. That’s been the case for a few years now, which is why a lot of Vegas’ success lives and dies with how Fleury plays.
Fleury’s been a reliable goaltender for years now, but at age 34, you have to start wondering if the heavy workload is creating diminishing returns. Fleury’s inaugural season with Vegas saw a .927 save percentage in 46 games of action – the season was so good he finished fifth in the Vezina race despite playing substantially fewer games than his peers.
But over the last 78 games since that run, his save percentage has sharply regressed to the league average. That’s fine if your team is dominating the shot share, but not so great if that shot share dominance isn’t turning up goals. That’s exactly what we are looking at here, with a Golden Knights roster that’s scoring on just 6.6 per cent (29th) of shots at 5-on-5 this year.
The stats may suggest it makes sense to remain bullish about this Vegas team, but you wonder if they’re going to get into the goaltender market relatively soon. Shaky goaltending is the one thing that can sink even the most talented teams, and I can’t imagine Vegas has much interest in playing their 34-year-old goalie 60-plus games again this season.
Data via Evolving Hockey, Hockey Viz, Hockey Reference, and HockeyDB