
Dec 20, 2021
Matthews’ production now matching his underlying numbers
Toronto’s superstar sniper has taken the league by storm over the past month, going on an offensive run that has him back in the Rocket Richard Trophy race, Travis Yost writes.
By Travis Yost

So, how about that scoring breakout by Auston Matthews?
On Nov. 17, we posited that Toronto’s superstar sniper was primed for a scoring surge. At the time, Matthews was struggling to find the back of the net. He had managed seven goals over the first 14 games, hardly a cause for concern, and yet an impossibly low number to fathom considering what the underlying numbers were suggesting.
The hallmark indicators of a player primed for favourable regression are clear. At the time, Matthews checked off every single box.
Recalling those five points:
- The player was near a career low in shooting percentage
- The player was near a career high in individual shot generation
- The player’s line was generating career-high shot volumes and scoring chances
- The player’s line was conceding the same amount of scoring chances and shots against as last year, indicative of little relative time spent in the defensive zone
- The player was averaging more than a night
Said differently, assuming Matthews was fully recovered from off-season wrist surgery, the Maple Leafs simply had to be patient and wait for the flurry of goals to arrive.
Over the past month, Matthews has taken the league by storm. No player has scored more goals (13) over the past month of the season, and only five players have amassed more points:
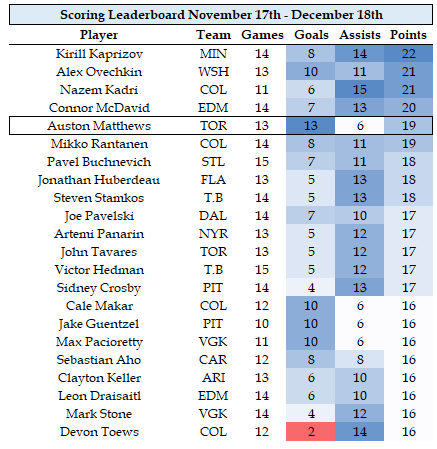
The scoring surge has put Matthews just three goals back of the lead for the Rocket Richard Trophy, and more importantly, this offensive tear has Toronto positioned to compete for first in the Atlantic.
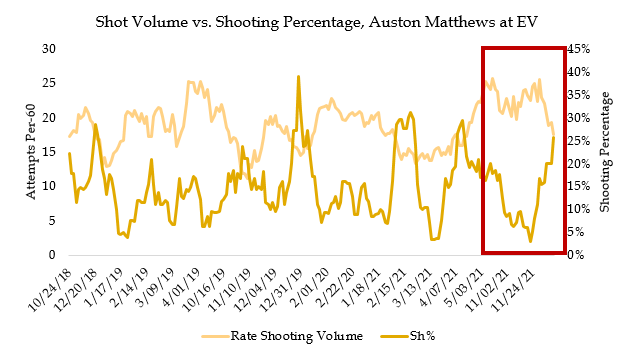
What does that look like on paper? Let’s update the key technical graphs from the piece a month ago, the first focusing on actual-to-expected goal scoring at even strength, the second focusing on shooting volumes and conversion rates.
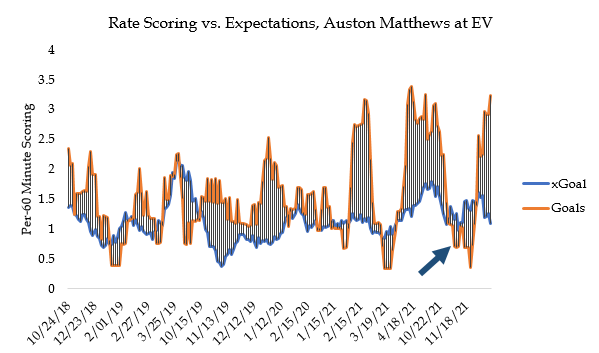
Matthews is one of the best shooters of the puck in the league, and routinely beats expected goal-scoring rates in short intervals. We suspected the relationship observed at the onset of the season – where expected goals for Matthews dwarfed his actual goal total – was both a rarity and exception to the rule. The rebound back to normalcy has been sharp, and no one is happier about that than Matthews himself. Or head coach Sheldon Keefe, I suppose.
Such a scoring outburst wouldn’t sustain itself if other meaningful indicators changed. If Matthews was generating fewer shots, or those shots were being generated from weaker scoring areas, our thesis falls apart. Over this blistering stretch, Matthews’ shot generation has remained in line with his historical averages. That’s acted as the basis for a ripper of a shooting percentage rebound:
The scoring surge also doesn’t correlate, at least meaningfully, with a change in usage or a change in the quality of his teammates.
On the usage side, Keefe has remained persistent with Matthews’ minutes, playing him about 20 minutes a night. When it comes to teammates, little change there as well. Using the last 10 games as an example, Matthews has seen winger Michael Bunting glued to his hip on one side, and a rotation of Mitch Marner, Wayne Simmonds, and Ondrej Kase on the other side. Other than a small minutes reduction from early-season linemate William Nylander, there’s not a whole lot going on when it comes to deployment.
And herein lies one of the more frustrating parts about hockey and hockey analysis. Sometimes random chance, variation, and volatility are the explainers of what happens in small sample sizes. When a player goes through an unexpected scoring lull (or surge, for that matter), we spend an inordinate amount of time trying to understand inputs and outputs and trying to explain why something changed so suddenly.
But when you can reasonably rule out all possible explanations, it usually just comes down to time. The Maple Leafs were able to pick up plenty of victories when the Matthews line wasn’t scoring, biding their time. Now they are on fire, and Toronto looks one of the best teams in the league once more.
Data via Natural Stat Trick, Evolving Hockey, NHL.com