
Dec 1, 2016
Metropolitan Division proving mighty this season
For the first time in a long time, the power in the National Hockey League is shifting to the Eastern Conference, Travis Yost writes
By Travis Yost

For the first time in a long time, it’s starting to feel like the power in the National Hockey League is shifting to the Eastern Conference.
More specifically, it’s shifting to the Metropolitan Division.
In one of the more interesting, under-the-radar developments of the 2016-17 season, the Metropolitan Division has been kicking around the rest of the National Hockey League. This is partly because a number of teams out West seem to have taken at least one step backward. Perennial powers in Chicago, Los Angeles and Anaheim are still quality hockey teams, but inarguably weaker versions of what we observed during their heyday.
Middle-of-the-pack teams in Dallas, Minnesota, Nashville, and Calgary have all gone through stretches where they looked in disarray. Arizona and Vancouver are just totally uncompetitive.
Where the West has weakened, the Metropolitan has picked up the slack. Of the eight teams, seven are about where we would have expected or better, with only the New York Islanders a legitimate disappointment. On most nights, though, these eight teams tend to show up as better than their competition.
It’s materialized in the numbers. Just look at how the Metropolitan has fared by straight point percentage against each of the other divisions through the first two months. Against the Central, they are averaging 1.41 points per game, or the equivalent of a 115-point team. Against the Pacific, they are averaging 1.21 points per game, or the equivalent of a 99-point team. Against the Atlantic, they are averaging 1.05 points per game, or the equivalent of an 86.5-point team. That’s total domination against the West, and about breaking even in the East.
But, wins and losses can be a bit noisy, especially at this time of year. There’s a way we can better illustrate the incremental gains the Metropolitan has made over the rest of the league in 2016-17. Below, I’ve rolled up divisional Corsi%, Scoring Chance%, and Goal% since the NHL realigned in 2013-14. As you can see, the West was king for a few years in a row (and, it should be noted, for a few years before realignment).
This year it’s hard to argue that the Metropolitan isn’t top dog. And remember, since we are considering seven or eight teams across 20 or so games, there are an awful lot of shots and chances and goals to consider. This isn’t small sample size theatre.
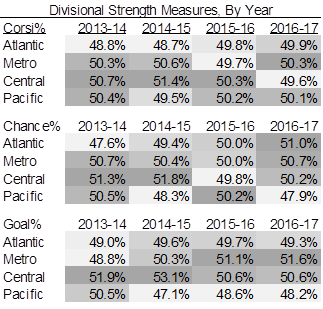
The darker the cell, the more relatively dominant the division was in that time period. Again, the West was king for some time, and one of the interesting debates is whether or not the Central was better than the Pacific over that 2013-15 timeframe. I think the Pacific had a reputation of being tops (mostly because Los Angeles, Anaheim, and San Jose were so unbelievably good during this era), but it ignores the fact that the rest of the division was terrible, bringing down the divisional averages. The Central had much more balance and, at aggregate, was more competitive.
But this year, you have to consider the Metropolitan at the top of the divisional list. All of these numbers just legitimize the win/loss record we are seeing around the league – they are dominating the shots, dominating the chances, and really dominating the goals.
Their dominance over the goal front might partly be a bit of puck luck (the Rangers, Capitals, and Blue Jackets are all in the top five in shooting percentage year-to-date), but it’s also hard to ignore the very real and very sustainable impacts goalies like Henrik Lundqvist, Cory Schneider, Braden Holtby, et al. are having on the division’s bottom line.
One brief aside: It’s going to be really interesting to see what happens with the Pacific Division by season’s end. Is it possible it’s the weakest division in the league? I think it’s a compelling race between the Pacific and the Atlantic – something that was totally unimaginable just a few seasons ago.
As for now, I think we might have to start getting comfortable with the power shift happening around the league. It’s real, and it’s impressive.